- Research
- Open access
- Published:
GIS-based landslide susceptibility mapping and assessment using bivariate statistical methods in Simada area, northwestern Ethiopia
Geoenvironmental Disasters volume 7, Article number: 20 (2020)
Abstract
Simada area is found in the South Gondar Zone of Amhara National Regional State and it is 780Km far from Addis Ababa. Physiographically, it is part of the northwestern highlands of Ethiopia. This area is part of the Guna Mountain which is characterized by weathered volcanic rocks, rugged morphology with deeply incised gorges, heavy rainfall and active surface processes. Many landslides have occurred on August 2018 after a period of heavy rainfall and they caused many damages to the local people. In this study, Frequency Ratio (FR) and Weights of Evidence (WoE) models were applied to evaluate the landslide causative factors and generate landslide susceptibility maps (LSMs). The landslide inventory map that consists of 576 active and passive landslide scarps was prepared from intensive fieldwork and Google Earth image interpretation. These landslide locations were randomly divided into 80% training and 20% validation datasets. Seven landslide causal factors including aspect, slope, curvature, lithology, land use, rainfall and distance to stream were combined with a training dataset using GIS tools to generate the LSMs of the study area. Then the area was divided into five landslide susceptibility zones of very low, low, moderate, high and very high. Later, the resulting maps have been validated by using area under the curve and landslide density index methods. The result showed that the predictive rate of FR and WoE models were 88.2% and 84.8%, respectively. This indicated that the LSM produced by FR model showed a better performance than that of WoE model. Finally, the LSMs produced by FR and WoE models can be used by decision-makers for land use planning and landslide mitigation purpose.
Introduction
Landslides are one of the recurrent natural problems that are widespread throughout the world, especially in mountainous areas which caused a significant injury and loss of human life, damage in properties and infrastructures (Parise and Jibson 2000; Dai et al. 2002; Glade et al. 2005; Kanungo et al. 2006; Pan et al. 2008; Girma et al. 2015). The term “landslide” is the movement of a mass of rock, debris or earth down a slope under the influence of gravity (Varnes 1978; Hutchinson 1989; WP/WLI - International Geotechnical Societies’ UNESCO Working Party on World Landslide Inventory 1990; Cruden 1991; Cruden and Varnes 1996). Landslides are caused by different triggering factors such as heavy or prolonged precipitation, earthquakes, rapid snow melting and a variety of anthropogenic activities. Landslides can involve flowing, sliding, toppling or falling movements and many landslides exhibit a combination of two or more types of movements (Crozier 1986; Cruden and Varnes 1996; Dikau et al. 1996).
Landslide in Ethiopia is a common phenomenon which often causes significant damage to people and property. Almost 60% of the total population in Ethiopia lives in the highland areas (Ayalew 1999) which is characterized by high relief, complex geology, high rainfall, rugged morphology, very deep valleys and gorges with active river incision. The rapid population growth demanded the use of areas which were not previously used for settlement, urban expansion, agricultural and other purposes thereby exposing these areas to landslide problems after rainy seasons (Temesgen et al. 2001; Abebe et al. 2010; Woldearegay 2013).
In recent years landslide incidences are increasing in the Ethiopian highlands due to man-made and natural causes (Meten et al. 2015b). For instance, from 1960 to 2010 alone, Landslides have killed 388 people, injured 24 people, and damaged agricultural lands, houses and infrastructures (Ayalew 1999; Temesgen et al. 1999; Woldearegay 2008 and (Ibrahim: Landslide assessment and hazard zonation in Mersa and Wurgessa, North Wollo, Ethiopia, unpublished)). According to Abebe et al. (2010), the highlands and mountainous area of Ethiopia like the Blue Nile Gorge, the Lower Wabe-Shebele River valley, Gilgel Gibe River, Tarmaber, Kombolcha - Dessie road, Uba Dema village in Sawla, Wondogenet area and many other parts of Ethiopia are repeatedly facing problems associated with landslides. The landslides in these areas are affecting human lives, infrastructures, agricultural lands and the natural environment. As a result of this, the study of the landslide has drawn global attention to increase awareness about its socioeconomic impacts and the pressure of increasing population and urbanization on mountainous areas (Kanungo et al. 2006).
The current study area is found in Simada District of South Gondar Zone in the Amhara National Regional State of Northwestern Ethiopia. It is part of the northwestern Ethiopian highlands. This area is severely affected by landslide incidences in recent years. Landslide incidence in the study area occurred on August, 2018 after a heavy and prolonged rainfall that caused the death of animals, destruction of houses and wide areas of cultivated and non-cultivated lands. Therefore, this area requires a detailed investigation to evaluate the causes, types and failure mechanisms of landslides and to prepare the landslide susceptibility maps. A systematic landslide study helps to reduce the damages in infrastructures, houses and cultivated lands and loss of lives. This importance will be noticed when these landslide susceptibility maps are used by decision-makers in regional land use planning, landslide prevention and mitigation measures.
For proper and strategic land use planning, it is important to evaluate and delineate landslide prone areas using different landslide susceptibility mapping techniques. Preparing a landslide susceptibility map of a certain area is a useful tool in landslide hazard management as it shows the degree of susceptibility of an area to landslide occurrence. It is obvious that landslide susceptibility maps can be generated based on the assumption that future landslide will occur under the same condition as in the past (Pham et al. 2015). Interpretation of future landslide occurrence needs an understanding of conditions and processes that control landslides in the study area. Past landslides and different conditioning factors such as slope morphology, hydrogeology and geology of the area are the main parameters to assess and evaluate landslide susceptibility by integrating these conditioning factors and past landslides in a GIS environment.
GIS-based landslide susceptibility mapping techniques have been used by several researchers (Aleotti and Chowdhury 1999; Kanungo et al. 2009) which can be classified into qualitative and quantitative ones (Yalcin et al. 2011; Felicisimo et al. 2012; Peng et al. 2014; Wang and Li 2017). Qualitative techniques include geomorphological analyses and inventory methods. These are based on expert judgment and are more subjective than quantitative methods. Quantitative methods such as deterministic analyses, probabilistic approaches and statistical techniques closely rely on mathematical models which have much less personal bias but still needs experience to produce and run these models (Aleotti and Chowdhury 1999; Kanungo et al. 2009). In recent years, many landslide susceptibility maps were produced using GIS-based statistical approaches like Frequency Ratio (FR) and Weights of Evidence (WoE) models. This is because the result from these models showed good performance with high accuracy and these models are very simple to implement and can provide the contribution of each causative factor class for landslide occurrence (Lee and Pradhan 2007; Akgun et al. 2007; Dahal et al. 2008; Işık Yilmaz 2009; Pradhan, Lee and Buchroithner 2010; Choi et al. 2012; Park et al. 2012; Vakhshoori and Zare 2016; Fayez et al. 2018).
Several researchers have used Frequency ratio model on landslide studies (Bahrain et al. 2014; Meten et al. 2015a; Haoyuan Hong et al. 2015; Pham et al. 2015; Pirasteh and Li 2017; Fayez et al. 2018; Khan et al. 2019) and in comparison with a few methods (Akgun et al. 2007; Lee and Pradhan 2007; Işık Yilmaz 2009; Choi et al. 2012; Park et al. 2012; Meten et al. 2015b; Wang and Li 2017). A combination of both FR and WoE models have been applied for landslide susceptibility mapping (Regmi et al. 2013; Rahmati et al. 2016). Gholami et al. (2019) also compared the prediction capability of frequency ratio, fuzzy gamma and landslide index models. Each GIS-based statistical method requires data on past landslides, preparatory causative factors and triggering factors. To prevent or mitigate any damage from landslides, it is essential to assess the landslide prone areas. The current study aims to carryout landslide susceptibility mapping by applying FR and WoE models in order to highlight critically high and very high hazard zones. This will help to reduce and mitigate any hazard associated with future landslide occurrence.
Study area
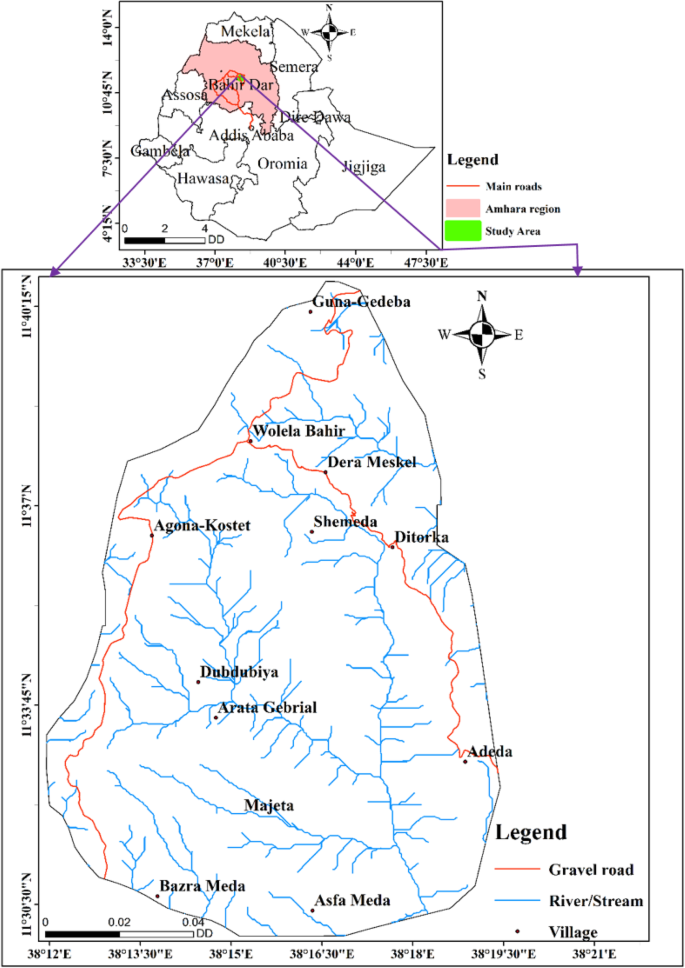
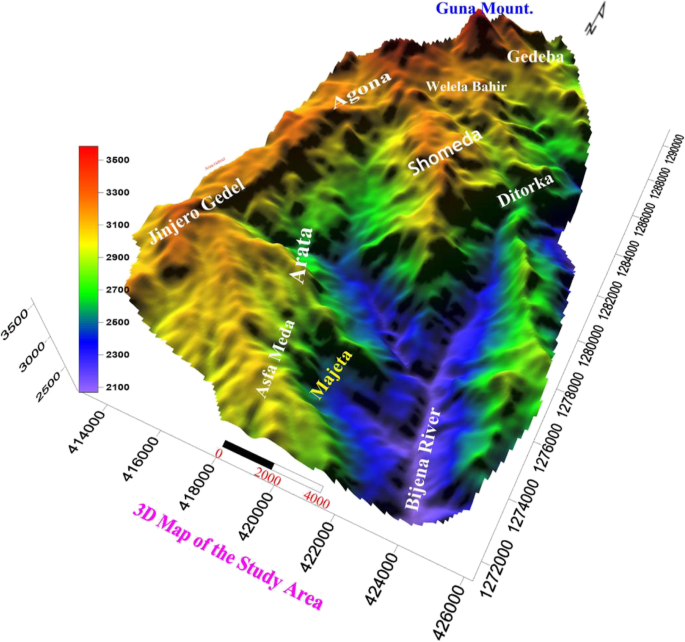
The study area is 185.7 square kilometers which is located in Simada District of South Gondar Zone, Amhara National Regional State, Ethiopia (Fig. 1). The area is bounded between 380 11' E and 380 20' E longitudes and 11030' N and 11041' N latitudes. The typical drainage pattern of the study area is dendritic and parallel. Atkus and Kostet Rivers are the main rivers that affect the study area by eroding the banks of rivers leading to slope instability. The confluence of these rivers forms Bijena River which is the largest river in the study area. Most of the rivers in the study area flow towards the southeast direction. The physiography of the study area forms the rugged topography of Guna Mountain (Fig. 2) which is part of the northwestern Ethiopian highlands. The area can be classified into two main physiographic regions. These are the plateau area and the rugged terrain. The plateau areas are characterized by volcanic landscapes that represent the high flatlands of the Kefoye, Agona and Jinjero Gedel areas. These areas are water divide zones in which rivers are flowing to Abay Basin in the west and to Bashilo Basin in the south. In this area, the slopes are ranging from flat slopes on the top to steeper slopes at the plateau scarp. The rugged terrain is highly dissected by major rivers and streams which are characterized by deep narrow valleys and gorges. Slopes in these areas are steep to vertical and susceptible to erosional and landslide phenomena. The elevation of the study area ranges from 2067m to 3586 m which comprises of medium to very high relief hills. The presence of steep scarps, rugged slope faces, deep gorges and steep ridges showed that this area is prone to active surface processes and landslide incidences. Based on elevation, the climatic zones of the study area are mostly falling under the highland climatic zone. The primary wet season extends from June to September. There is great variation in the rainfall amounts with maximum rainfall occurring during the wet season which starts in June and ends in September with the heaviest rainfall occurring during the months of July and August.
Methods
In order to achieve the objectives of this research, data collection and organization, preparation of landslide inventory datasets, database construction of landslide causative factors and application of FR and WoE models were carried out to prepare the landslide susceptibility maps and validate them.
Data collection and organization
The necessary data for this study were collected from various sources. These include collecting relevant literatures from published and unpublished papers, DEM data from USGS, a regional geological map from Geological Survey of Ethiopia at a scale of 1:250000, rainfall data from National Metrological Agency of Ethiopia, a topographic map from Ethiopian Geospatial Information Agency at a scale of 1:50000 and Google Earth image from Google Earth. During field work, data collection was carried out on different rock types by describing their character, the relative degree of weathering, slope steepness, location of springs and swamps, landslide inventory mapping on both active landslide and scarp areas by measuring their length, width, accumulation zone and depth (if possible), land use and land cover, man-made activities including farming practice. After compilation of the actual field investigation, the data has been systematically processed and analyzed first in ArcGIS followed by Microsoft Excel and then finally in ArcGIS.
Preparation of landslide inventory dataset
The quality of the landslide inventories depends on the accuracy, type and certainty of the information shown in the maps. New and emerging mapping methods, based chiefly on satellite, aerial and terrestrial remote sensing technologies, can greatly facilitate the production and the update of landslide maps. Literature review has shown that the most promising approaches exploit VHR optical, monoscopic and stereoscopic satellite images, analyzed visually or through semi-automatic procedures, and VHR digital representations of surface topography captured by LiDAR sensors. A combination of satellite, aerial and terrestrial remote sensing data represents the optimal solution for landslide detection and mapping, in different physiographic, climatic and land cover conditions (Guzzetti et al. 2012). Ye et al. (2019) detected landslides from hyperspectral remote sensing data using a deep learning technique.
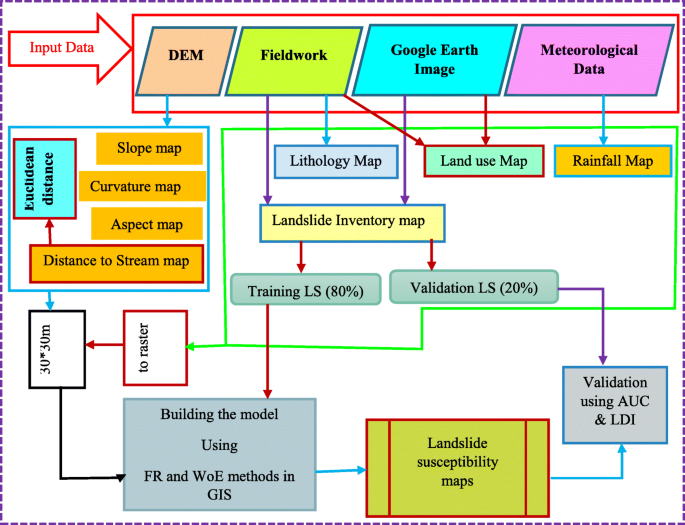
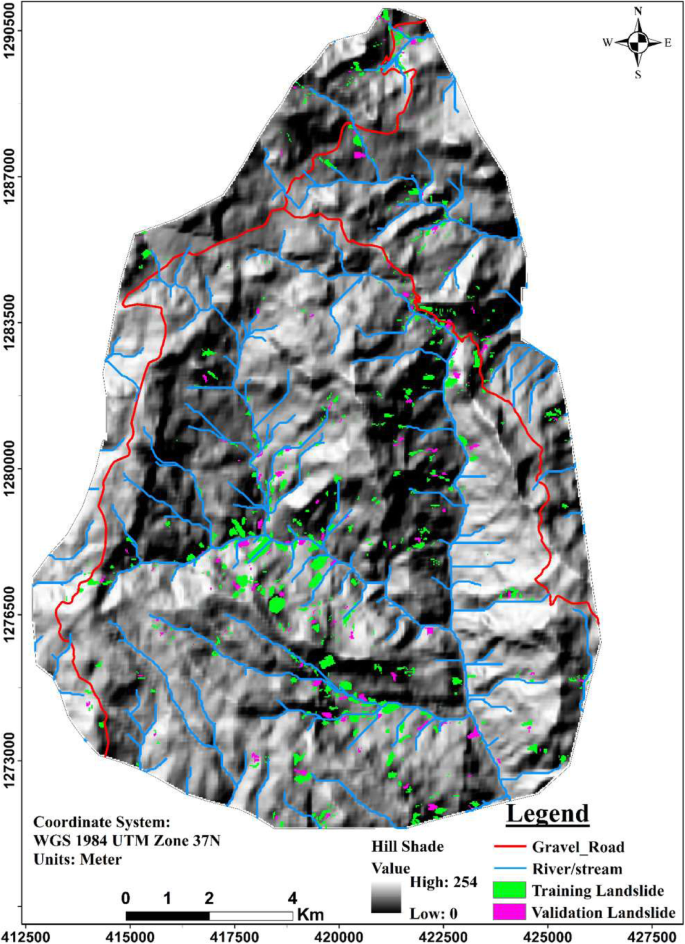
The landslide inventory dataset in the current study consist a total of 576 landslides which were identified from Google Earth image interpretation and intensive field survey. For landslide susceptibility mapping landslide polygons can be divided into training and validation datasets. The training dataset is used for constructing the predictive model while the validation dataset is used for validating the model. In this study, the specific date of landslide occurrence is not well known. Hence, the landslide polygons were randomly split into two classes with 80% for training and 20% for validation by keeping their spatial distribution into account (Fig. 3 and 4). In addition, the validation data sets for most of the landslide susceptibility or hazard assessments were chosen in between 20% and 30% of the total landslide inventory.
Database for landslide causative factors
To undertake landslide susceptibility analysis in the study area, a spatial database was first constructed for the causative factors within the spatial analysis tools of ArcGIS 10.4 software. The database consists of the landslide inventory datasets (training and validation) and the landslide causative factors (slope, aspect, curvature; land use, lithology, rainfall and distance from stream). These factors were subsequently evaluated by calculating their weights from the relationship between the landslide and landslide causative factors and then these results were verified. There are no strict rules or guidelines for the triggering factors to be used in different statistical approaches for landslide susceptibility mapping. Instead, the chosen factors should be operative and measurable depending on a particular area’s characteristics (Ayalew and Yamagishi 2005). One parameter may be an important controlling factor for landslide occurrence in a certain area but in most cases a combination of two or more landslide causative factors may be effective in addition to the triggering factor for landslide occurrence.
In this study, the triggering factor was heavy and prolonged rainfall. During the fieldwork, landslide locations were identified and marked with GPS, land use (land cover) types around the landslide scar, drainage networks and spring locations, lithological units and human activities were investigated to prepare the landslide susceptibility maps.
Generally, the selection of landslide causative factors should consider the nature of the study area and the availability of data. In this regard, a total of seven parameters were selected including slope, aspect, curvature, lithology, rainfall, land use and distance to stream. All causative factor maps were converted into raster maps with the same coordinate system (WGS 1984 UTM zone 37N) and the same pixel size (30mx30m). The rasterized training (80%) landslide map and all the causative factor maps have been overlaid and the information was extracted using the spatial analyst tool of ArcGIS to calculate the ratings or weights of all factor classes for FR and WoE models. The summation of these ratings or weights of each landslide factor will help to evaluate the spatial relationship between them and the probability of landslide occurrence in the study area.
Topographic parameters like slope, aspect, curvature and distance to stream maps were derived from Digital Elevation Model (DEM) with a cell size of 30 m by 30 m. Lithology and land use maps were prepared from intensive fieldwork and Google Earth image interpretations. The rainfall map was generated using IDW interpolation technique of the spatial analyst tool in ArcGIS from four rain gage stations near to the study area using the rainfall data from National Meteorological Agency of Ethiopia.
Frequency ratio (FR) model
Frequency Ratio model is a well-known and widely used bivariate statistical method that is used for landslide susceptibility mapping (Lee and Talib 2005; Akgun 2012; Demir et al. 2013; Mezughi et al. 2011; Yalcin et al. 2011; Abay and Barbieri 2012; Mondal and Maiti 2013; Paulin et al. 2014). In this model, processing the input data, computations and output-processes are very simple and can be easily understood. It is simple and relatively flexible to use and implement a landslide susceptibility map with accurate results (Lee and Pradhan 2007; Yilmaz 2009; Choi et al. 2012; Mohammady et al. 2012; Park et al. 2012). The frequency ratio model is one of the probabilistic models which are based on the observed relationship between the distribution of landslides and each landslide related factor (Lee and Talib 2005). To evaluate the contribution of each factor towards landslide susceptibility, the training landslide group was combined with thematic data layers separately and then the frequency ratio of each factor’s class was calculated according to the following procedures.
First, the number of pixels for landslide occurrence and non-occurrence in each factor’s class was calculated. Second, the percentage of each factor’s class having landslide to the total pixels containing landslide of the factor was calculated and the percentage of each factor class’s number of pixels to the total number of pixels in the study area was calculated. Finally, the frequency ratio of each factor class was obtained by dividing the percentage of landslide pixels to the percentage of area pixels in each factor classes (Equation 1).
Where; Npix(Si, j) = the number of pixels containing landslide within class j in factor i; Npix(Ni, j) = the number of pixels of class j in factor i; ∑jNPix(Si, j) is the number of total pixels containing landslide in the study area; ∑jNPix(Ni, j) is the number of total pixels in the study area.
The calculated FR value represents the degree of correlation between landslide and a certain class of the causative factor. A value of 1 is an average value for the landslide occurrence of a specific landslide causative factor class. A value more than 1 indicates a strong and positive correlation and a high probability of landslide occurrence, while a value of less than 1 indicates a negative relationship and low probability of landslide occurrence in a certain class of a landslide causative factor. The FR map of each causative factor is prepared with the help of ArcGIS by assigning the calculated FR values. Then the FR values of all the causative factor maps were overlaid and numerically added using the raster calculator of the spatial analyst tool in ArcGIS 10.4 to prepare the Landslide Susceptibility Index (LSI) map. LSI is computed by summing the FR values of all the landslide causative factor maps (Equation 2) and then the resulting LSI map was further reclassified in to very low, low, moderate, high and very high landslide susceptibility classes.
Where: LSI = Landslide susceptibility index, FR is the frequency ratio and n is the number of selected causative factors. The calculated values of FR for each pixel in the LSI indicate the relative susceptibility to landslide occurrence. The higher LSI pixel values have high susceptibility to landslide occurrence while the lower LSI pixel values have lower susceptibility (Akgun et al. 2007).
Weights of evidence (WoE) model
WoE model is a log-linear form of the Bayesian probability model for landslide susceptibility assessment that uses landslide occurrence as a training point to drive prediction outputs. It calculates both unconditional and conditional probability of landslide hazards. This method is based on the calculation of positive and negative weights to define the degree of spatial association between landslide occurrence and each explanatory variable class (Pardeshi et al. 2013). The positive weights (W+) indicate the occurrence of an event while the negative weight (W-) indicates the non-occurrence of an event. To evaluate W+ and W-, calculating the following parameters is important.
-
Nmap = total number of pixels in the map
-
Nslide = number of pixels with landslides in the class
-
Nclass = number of pixels in the class
-
NSLclass = number of pixels with landslides in the class
The values needed for the weight of evidence formula are:
-
Npix1 = NSLclass
-
Npix2 = Nslide – NSLclass
-
Npix3 = Nclass – NSLclass
-
Npix4 = Nmap – Nslide – Nclass + NSLclass
Then the positive and negative weights are calculated as follows (Equations 3 and 4).
Where Npix1 is the number of landslide pixels present on a given factor class, Npix2 is the number of landslides pixels not present in a given factor class, Npix3 is the number of pixels in a given factor class in which no landslide pixels are present and Npix4 is the number of pixels in which neither landslide nor the given factor is present (Van Westen 2002; Dahal et al. 2008; Regmi et al. 2010). These weights are used to calculate a weight of contrast value (C) for the particular susceptibility variable (Equation 5).
The contrast value (C) measures the strength of a relationship between the causative factors and landslides. If the contrast value is positive, it will have a positive spatial association while the negative one will have a negative spatial association. The weighted map (Wmap) for each landslide causative factor can be prepared by summing the weights of contrast(C) values of each factor class. Similarly, the final landslide susceptibility index (LSI) map was prepared by summing all the weighted maps (∑Wmap) of each landslide causative factor through a raster calculator of map algebra in the spatial analyst tool of ArcGIS as follows (Equations 6 and 7).
Landslide inventory
During August, 2018, an intense rainfall in Simada area triggered many landslides that occurred mostly in rural areas. The damage was severe in the villages of Dubdubiya, Asfa Meda, Gedeba, Ditorka and at several other sites along the river courses. Particularly, in Dubdubiya and Asfa Meda villages, landslides damaged 81 dwellings, killed 14 goats, affected thousands of people, damaged hundreds of hectares of farmlands and dislocated 486 people. These problems occurred in these villages as the settlement areas are mostly located at the foot of a steep slope that is covered by weathered volcanic rocks as well as the presence of stream accumulated debris and earth flows that can suddenly burst out at the at the outlets of a mountain. Landslide inventory map of the study area (Fig. 4) was prepared from the combination of an intensive field survey and Google Earth image interpretations. Extensive field studies conducted from mid-November to mid-December of 2018 helped us to map known landslides using GPS and check the size and shape of these landslides in order to identify the type of movements, materials involved and to determine the state and activity of landslides (active, reactivated, dormant, etc.). This inventory data was mapped as vector-based polygon data and then converted to the raster format with a pixel size of 30m by 30m in ArcGIS 10.4.
In the present study area, a total of 576 landslides that contain 6304 pixels were identified and divided randomly into training and validation landslides by keeping their spatial distributions into account. The training landslides that accounted 80% of landslides with 5126 pixels were used for building the predictive model while the validation landslides that accounted 20% of landslides with 1178 pixels were used for validating purpose. From the total landslide polygons, 117 landslides were active landslides collected from field investigations while the remaining 459 landslide polygons were collected from time serious Google Earth image interpretations.
Landslide locations are predominantly distributed in the south-central, in the north and in the eastern parts of the study area with decreasing order of landslide density, damage on agricultural land and infrastructures. This area consists of a rugged and mountainous terrain which is characterized by steep slopes, deep gorges, high relief and fractured and weathered rocks. The common types of landslide occurrence in the study area include rock slide, rockfall, earth slide, debris slide and debris flow, rotational and translational soil slide, translational debris slide, rotational debris slide and complex types of slides. Generally, these landslides predominantly affected the rural areas in which the type of landslides and their probable causes and damages are described below.
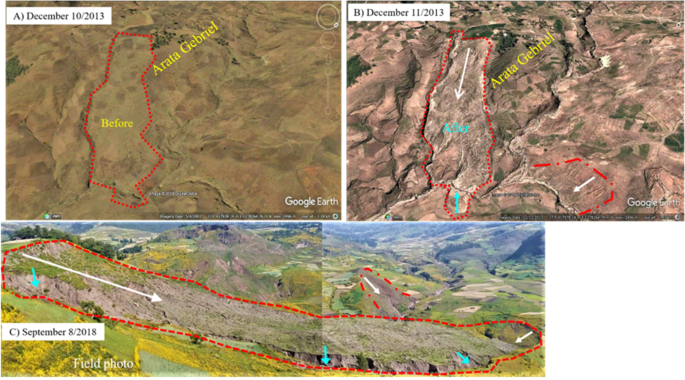
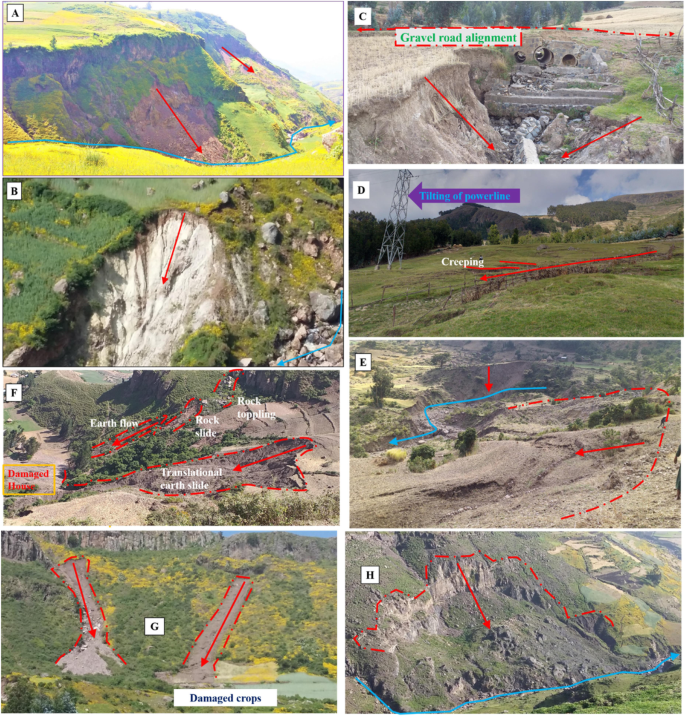
Most prominent landslides occurred in Asfa Meda, Dubdubiya, Tej Wuha-Gedeba and Ditorka-Megersum Villages. Landslides in Asfa Meda Village occurred at the interface between thin residual soils and rhyolitic rock and most of the landslides are shallow rotational and/or translational earth slides. Most of Dubdubiya village was highly affected by stream undercutting, erosion of the slope surface, riverbank erosion and improper farming practice (Fig. 5). The slope materials are dominantly covered by weathered basalt and colluvial deposits. Erosional opening surfaces and tension cracks were observed during field investigation indicating that seeping water might have brought instability of the slope through internal erosion of the weathered materials. A typical example of a landslide in this village was the landslide that occurred near Arata Gabriel Church. The main causes of this landslide were stream/river undercutting, presence of spring on top of the slope and colluvial soil slope materials. The slope material in Teji Wuha and Gedeba Villages is dominantly covered with weathered tuff and thin residual soils. In this village, there is an indication of shallow groundwater since the swamp area and many springs are observed with rotational and soil creep. Creeping of soil was identified by tilting of powerlines and fences (Fig. 6d). The common types of landslides that were observed in Ditorka and Megersum villages were rockslide (Fig. 6a), rock fall, debris slide (Fig. 6b) and rotational slide.
Historical landslide data in Dubdubiya Village as detected from Google Earth image. The white arrow and the red broken line in the figures indicate the direction of the slope movement and a landslide boundary respectively. a Image before the landslide event. b Image after landslide occurrence and, c Photo of the current condition
Field photo of landslide and their damage in different villages of the study area (Red and blue colored arrow indicates the direction of slope movements and River/stream flows respectively). In Ditorka and Megersum Villages- (a) Rockslide (b) Debris slide; Teji Wuha and Gedeba Villages- (c) Earth slide on the gravel road (damaged culvert) (d) Creep (tilting of powerline); in Asfa Meda Village- (e) and (f) Complex type landslides; in Dubdubiya Village- (g) Shallow debris flow that damaged wheat crop and (h) Rockslide
Landslide causative factors
The spatial distribution and density of landslides are mainly controlled by topography of an area, weather condition, geology, land use/land cover and anthropogenic factors (Khan et al. 2019). Consequently, evaluating the impact of these causative factors on the spatial distribution of landslides is very important in order to understand their failure mechanism and to prepare the landslide susceptibility map. In this study, seven causative factors that have been used for the preparation of landslide susceptibility maps include slope, aspect, curvature, lithology, land use/ land cover, rainfall and distance to stream. The roles played by each of these causative factors will be discussed in the following sections.
Slope
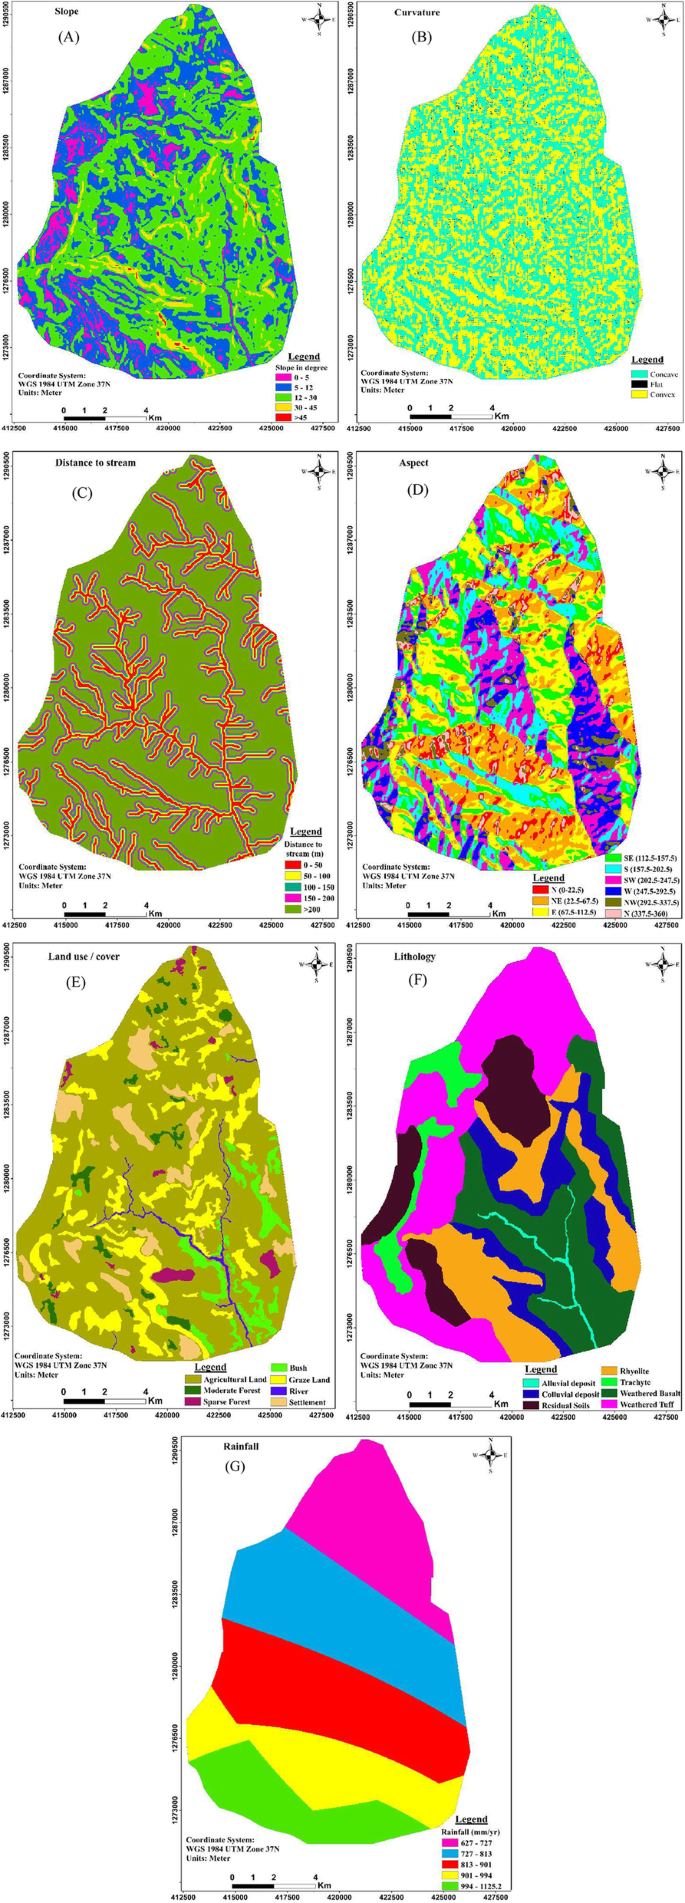
Slope is a very important parameter for landslide study as it has a direct relation with landslide occurrence. As a result, it is frequently used in preparing a landslide susceptibility map (Yalcin and Bulut 2007). It is well known that landslide occurs more frequently on steeper slopes due to gravity stress. The slope map (Fig. 7a) of the study area was prepared from DEM data. It was divided into five classes such of 0 – 50, 50 – 120, 120 – 300, 300 – 450, and > 450. For slope classes above 120, the frequency ratio is increasing which indicate the higher probability of landslide occurrence in these classes (Table 1).
Curvature
Curvature map of the study area was generated from DEM data and it was classified into 3 classes of concave, convex and flat surfaces (Fig. 7b). Following heavy rainfall, a convex or concave slope contains more water and retains this water for a longer period (Lee and Talib 2005). The more positive or negative values indicate the higher probability of landslide occurrence. In the flat area, the probability of landslide occurrence is very low. A positive curvature indicates that the surface was upwardly convex at that grid. A negative curvature indicates that the surface was upwardly concave at that grid and a value of zero indicates that the surface is flat.
Aspect
Aspect refers to the slope orientation which is generally expressed in terms of degree from 00 – 3600. It is considered as an important factor in landslide studies as it controls slope’s exposure to sunlight, wind direction, rainfall (degree of saturation) and discontinuity conditions (Komac 2006). Slope aspect map (Figure 8c) in this study area was derived from DEM data and it was divided into nine classes, namely; north (0 – 22.5, 337.5 - 360,), northeast, east, southeast, south, southwest, west and northwest (Fig. 7d).
Distance to stream
The proximity of the slope to the stream course is an important factor that dictates the landscape evolution of the area and an indicator of the landslide and related erosional aspects. Rivers with a number of drainage networks have a high probability of landslide occurrence as they erode the slope base and saturate the underwater section of the slope forming material (Akgun and Turk 2011).
Since there are many streams in the study area which flow into Kostet, Atkus and Bijena Rivers, many landslides occurred in the close vicinity of these rivers. Hence, this parameter was considered as one causal factor in landslide susceptibility analysis. Zones with parallel pattern of drainage in steep slopes are the most probable landside sites. Drainage often plays its own role in developing pore-water pressure which reduces the shear strength of slope materials. Streamlines were derived from DEM data and it was classified based on stream order.
Landslide in this area is mostly associated with 1st, 2nd, and 3rd order streams. Distance from stream map was developed from Euclidean distance buffering method in the spatial analyst tool of ArcGIS 10.4. This map was classified in to five subclasses: 0 – 50, 50 – 100, 100 – 150, 150 – 200 and > 200 meter (Fig. 7c).
Land use / land cover
Land-use change has been recognized throughout the world as one of the most important factor influencing the occurrence of rainfall-triggered landslides. Changes in land use/cover resulted from man-made activities such as deforestation, overgrazing, intensive farming and cultivation on steep slope can initiate slope instability (Glade 2003). Vegetation has a major contribution to resist slope movements. Vegetation having a well-spread network of root systems increases shearing resistance of the slope material. This is due to the natural anchoring of slope materials. In addition to this, it reduces the action of erosion and adds the stability of the slope. In another way, barren or sparsely vegetated slopes are usually exposed to erosion and thus it has the effect of increasing slope instability. The land use map of the study area was prepared from the Google Earth image of 2016 and the analysis was done in ArcGIS. About seven land-use types were identified including moderate forest, sparse forest, bush, grazing land, agricultural land, settlement and river (Fig. 7e). The area is predominantly covered by agricultural land and grazing land.
Lithology
Lithology is one of the most controlling parameters in slope stability since each class of materials has different shear strength and permeability characteristics (Yalcin and Bulut 2007). Different rock types have varied composition and structure which contribute to the strength of the slope material in a positive or negative way. The stronger rock units give more resistance to the driving forces as compared to the softer/ weaker rocks. Lithological map of the study area was prepared from existing regional geological map (with a scale of 1:250,000) as a preliminary map for further improvement of a lithologic map into a scale of 1:50,000 based on a detailed field survey. The study area contains seven lithological units namely Trachyte, Weathered tuff, Rhyolite, Weathered basalt, Residual soils, Colluvial and Alluvial Deposits (Fig. 7f).
Rainfall
Rainfall is considered as an influencing factor to cause slope instability. Precipitation, particularly intense and prolonged rains are controlling factors that trigger landslides by providing water thereby increasing underground hydrostatic level and pore water pressure. When the soil undergoes such pressure changes, water within it will create negative or upward pressure, as it cannot drain quickly. When the pore water pressure is equivalent to the upper pressure, the shearing resistance of the material decrease and will lead to failure of the material. The rainfall data of the four stations that surround the study area were collected from National Metrology Agency of Ethiopia. There are various interpolation techniques in ArcGIS to interpolate rainfall over a large area based on few point data. These include Thiessen polygon, Isohyetal, average arithmetic, inverse distance weight (IDW) and Kriging. The general assumption of the IDW method of interpolation is that the value of unsampled point is the weighted average of known values within the neighborhood. Therefore, the values from a scattered set of known points can be utilized to assign rainfall values to unknown points. It can be used to compute the unknown spatial rainfall data from the known sites that are adjacent to the unknown sites (Chen and Liu 2012). The rainfall map of the study area was prepared using the IDW interpolation method in GIS. The rainfall data analysis showed that the maximum monthly rainfall occurs in June, July, August and September which coincides with the landslide occurrence in this area. The rainfall map of the study area was divided into five annual rainfall classes of 627 – 727, 727 – 813, 813 – 901, 901 – 994 and 994 - 1125.2 millimeters (Fig. 7g) by the natural breaks method.
Result and discussion
Relationship between landslide and causative factors
This study has analyzed the relationship between seven causative factors and landslide occurrence. Using the FR and WoE models, the relative frequency values and the weights of values were calculated respectively. The causative factors were classified into different classes and weights were assigned to them for both FR and WoE models as presented in Table 1 and 2 respectively. These results showed that the relative susceptibility of each class is almost similar for both models but the parameters and results are different from each other. This implies that if a factor class has lower and higher values in both models, the susceptibility will also be lower and higher respectively. In case of FR model, the spatial relationship between the causative factors and landslide is determined by FR values. The causative factor classes with FR value > 1 will have a high degree of landslide occurrence. On the other hand, for the WoE model, C describes the correlation and spatial association of the landslide with the causative factors. The positive C values indicate a positive association with more landslide occurrence and vice versa for negative C values. The weights with higher values indicate a higher degree of influence on landslide occurrence. Generally, the factor class values derived from each model showed the spatial relationship of the causative factors in their contribution to landslide occurrence. The association is more or less the same in both models.
The slope classes > 120 have higher contribution for landslide occurrence. The area with a slope class > 450 is the most landslide prone class while the area with a slope class < 50 is the least one. Generally, as the slope increases, the probability of landslide occurrence also increases. In case of aspect classes, the FR values of slope classes facing towards the northeast (22.5 – 67.5), east (67.5 – 112.5) and north (0 – 22.5) are greater than one indicating a higher probability of landslide occurrence. The northeast facing aspect class has got the maximum weight or rating followed by the east facing ones. The curvature range of (-3.6) - (-0.001) has a greater contribution to the slope failures. In case of lithology, three units i.e. colluvial deposit, weathered basalt and rhyolite have high probability of landslide occurrence. Colluvial deposit and weathered basalts have less strength and hence susceptible to landslides. Rhyolitic rocks in the study area formed a cliff underlying thin residual soils. As a result, most of the landslides occurred at the contact between rhyolite and thin residual soils.
The type of land use also controls the occurrence of landslide in the study area. The highest weights or ratings were observed in the land use types of grazing land, river, sparse forest and bushes indicating a high probability of landslide occurrence. The highest weighted value of grazing land is due to its exposure to erosion and weathering. In case of the relationship between landslide occurrence and the distance from stream, as the distance from stream increases, the occurrence of landslide generally decreases. Landslide occurrence is higher in the first three classes of 0 – 50m, 50 – 100m and 100 – 150m (Table 1 and 2). With regard to the causative factor rainfall, two classes with 813 – 901mm and 901 - 994 mm have a higher C and FR values than the other classes and are the most susceptible classes (Table 1 and 2). Generally, slope classes > 200, land use classes of grazing land, sparse forest, river and bush; lithology of colluvial deposit, weathered basalt, alluvial deposit and rhyolite and distance to stream classes of < 150 m buffers are the most contributing factor classes among the seven landslide factor classes.
Landslide susceptibility mapping using FR and WoE models
Frequency ratio model
Map of each causative factor is prepared with the help of ArcGIS and then the frequency ratio values were calculated. The calculated FR values for each pixel in the LSI indicate the relative susceptibility to landslide occurrence. The higher pixel values of LSI have the higher landslide susceptibility while the lower pixel values will have lower susceptibility (Akgun et al. 2007). The landslide susceptibility index was calculated based on the frequency ratio values that have been determined in the training process that can be added in a raster calculator of ArcGIS as follows (Equation 8).
Where FRsl = frequency ratio value of slope, Fras = frequency ratio value of aspect, = FRcu = frequency ratio value of curvature, FRli = frequency ratio value of lithology, FRlu = frequency ratio value of land use, FRrf = frequency ratio value of rainfall, FRds = frequency ratio value of distance to stream.
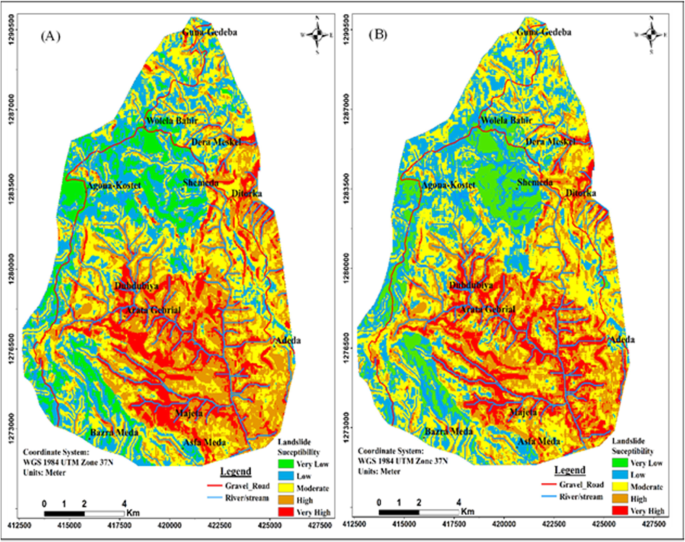
The LSI values for the frequency ratio model in the study area range from 2.89 to 15.09. The LSI map is reclassified to prepare the landslide susceptibility map of the study area (Fig. 8a). There are different types of classification methods such as natural break, equal interval, manual, standard deviation and quantile. In the current study, reliable results were obtained from natural breaks method. The result of other classification methods revealed the susceptibility classes with a high degree of exaggeration where large part of the study area fall into the high susceptibility class.
Therefore, the LSI values were classified into five susceptibility classes of very low (2.89 - 5.31), low (5.31 - 6.24), moderate (6.24 - 7.23), high (7.23 - 8.39) and very high (8.39 - 15.09) using the natural breaks method of classification. The result from Table 3 showed that 8.616% (16 km2), 20.474%(38km2), 29.537%(54.9km2), 27.898% (51.8 km2) and 13.474% (25 km2) areas fall into the very low, low, moderate, high and very high susceptibility classes respectively. As Fig. 8a clearly shows, the very low and low susceptibility classes are dominantly concentrated in the northwestern and southwestern plateau part of the study area including Welela Bahir, Shomeda, Agona and Jinjero Gedel localities. Similarly, the very high and high susceptibility classes are concentrated in the south central, southeastern and eastern part of the study area particularly in Asfa Meda (Majeta), Dubdubiya (Arata Gebriel) and Ditorka-Megersum respectively and scarcely distributed in the northern part of the study area at Guna-Gedeba Village and in the western part. Moderate susceptibility classes are mostly distributed throughout the study area. The high concentrations of landslides in those high and very high susceptibility classes of the aforementioned areas were due to the presence of colluvial and alluvial deposits, stream undercutting, scattered vegetation cover, man-made activities like intensive farming, deforestation and cultivation.
Weights of evidence model
The landslide susceptibility map of the study area by WoE model was produced based on the weighted values from the seven causative factors and the training landslide (Table 2). The difference between W+ and W- is known as the weight of contrast which is designated by C = W+ - W-. This reflects the overall spatial association between the causative factors and landslides. LSI map of the study area was prepared by summing the weight of contrast values (C) of all the seven causative factors using a raster calculator in ArcGIS as follows:
Where LSI = landslide susceptibility index; Csl = weight contrast value of slope, Cas = weight contrast value of aspect, Ccu = weight contrast value of curvature, Cli = weight contrast value of lithology, Clu = weight contrast value of land use, Crf = weight contrast value of rainfall, Cds = weight contrast value of distance to stream.
The LSI values for the WoE model in the study area range from -7.84 to 4.52. The LSI map is reclassified by the natural breaks method of classification technique in order to prepare the landslide susceptibility map of the study area (Fig. 8a). Then, the LSI values were classified in to five susceptibility zones of very low (-7.84 - -3.72), low (-3.72 - -1.83), moderate (-1.83 - -0.28), high (-0.28 – 1.17) and very high (1.17 – 4.52). The result from Table 4 showed that 8.448%(15.7 km2), 21.408%(39.8km2), 33.140%(61.5km2), 23.787% (44.2 km2) and 13.216% (24.5 km2) area fall in the very low, low, moderate, high and very high susceptibility classes respectively.
Validation of the model
Without model validation, landslide susceptibility maps will not be meaningful. As a result, validation of the predictive model is an important step for landslide susceptibility mapping (Bui et al. 2012). A predictive model map was constructed by overlying 80% of the landslides (training) over the causative factors. This model was validated using validation landslides (20%) that were not used for building the model. There are various types of validation techniques for landslide susceptibility maps. In the current study, the performance of the LSMs produced by FR and WoE models were evaluated using Area Under the Curve (AUC) and Landslide Density Index (LDI).
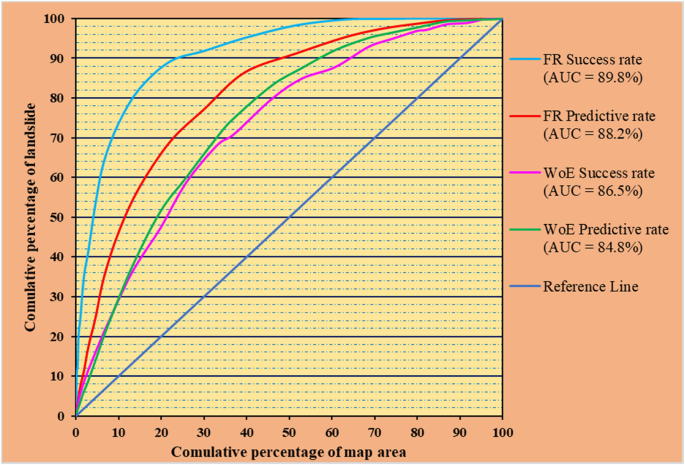
Area under the curve (AUC)
The area-under-curve (AUC) method works by creating success rate and prediction rate curves (Lee 2005). Landslide susceptibility maps can be validated by comparing the susceptibility maps with both the training landslide (80%) and validation landslide (20%). The success and predictive rate curves can be created for both FR and WoE models. The success rate curve is based on the comparison between the predictive model and the training landslide. The predictive rate curve is based on the comparison between the predicted map and the validation landslide. The Area Under the Curve (AUC) of the success rate represents the quality of the model to reliably classify the occurrence of existing landslides whereas the AUC of the predictive rate explains the capacity of the proposed landslide model for predicting landslide susceptibility (Pamela et al. 2018). AUC was calculated by reclassifying LSI into 50 classes with descending order of the values of pixels in the study area and combined with a landslide inventory. Then the rate curves were drawn through the cumulative percentage of both the training and validation landslide (y-axis) and cumulative area percentage (x-axis). The result showed that both models exhibited very good performances. However, the FR model is better with a success rate of 89.8% and a predictive rate of 88.2% than the WoE model with a success rate of 86.5% and a predictive rate of 84.8% (Fig. 9).
Landslide density index (LDI)
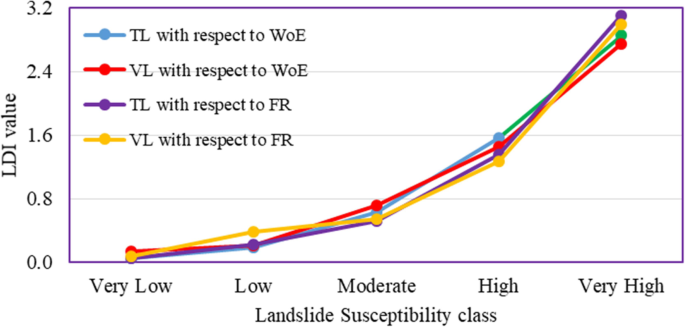
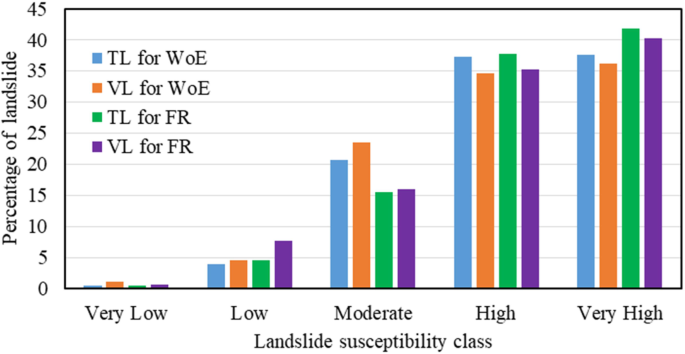
For validation of the model, landslide pixels which have not been used for constructing the models are generally considered as the future landslide area. In this work to check the validation of the landslide susceptibility model, the testing samples that consist of 20% of the landslide pixels were overlaid over the landslide susceptibility map. The landslide density index, which is the ratio between the percentage of landslide pixels and the percentage of class pixels in each class on landslide susceptibility map, was used to validate the model (Pham et al. 2015). If the value of the landslide density index is increased from low to a very high susceptibility classes, then the landslide susceptibility map is considered to be valid. LDI can be calculated using the formulae in eq. 10 below and its output was presented in Table 5. The suitability of any susceptibility map can be validated if more percentages of landslides occur in the high and very high susceptibility zones as compared to other zones (Fayez et al. 2018).
From Table 5, it can be observed that the landslide density values for very high susceptibility classes are 2.743 and 2.993 with respect to WoE and FR models which are remarkably higher than the other classes. In addition to this, there is a gradual decrement in landslide density values from very high to very low susceptibility classes (Fig. 10). This indicates the validity of the landslide susceptibility map. Can et al. (2005) and Bai et al. (2010) stated that the landslide data should lie in either the high or very high susceptibility classes for successful validation of a LSM. Table 5, Figs. 10 and 11 illustrate the characteristics of susceptibility classes for validation of both FR and WoE models. In general, the presence of the highest landslide percentage and density in the very high landslide susceptibility class indicates the reliability of the landslide susceptibility maps produced from FR and WoE models.
Conclusion
Landslide posed a significant impact at Simada District of South Gondar Zone in northwestern Ethiopia on human and animal lives, agricultural lands, settlements, infrastructures and also affected the social and economic aspects of the rural community. To investigate this problem, landslide susceptibility mapping has been carried out using FR and WoE models for proper land use planning, development and management of landslide prone areas. For this, a landslide inventory map of the study area with a total of 576 landslides was divided into training and validation landslides with 80 % and 20% respectively. Seven landslide causative factors including slope, aspect, curvature, lithology, land use, rainfall and distance to stream were considered to analyze, evaluate and establish the spatial relation of these factors with landslides. From FR values and WoE contrast values, it was possible to identify which factor classes are playing a significant role for the occurrence of landslides in the study area. The FR values that are greater than 1 and the WoE contrast (C) values that are greater than 0 were found in the factor classes of slope greater than 12°; curvature classes (-3.60) - (-0.001); aspect classes facing towards N (0 – 22.5), NE (22.5 – 67.5) and E (67.5 – 112.5); distance to stream classes (< 150m); land use classes (grazing land, river, sparse forest and bushes); lithology classes (colluvial deposit, alluvial deposit, weathered basalt and rhyolite), rainfall classes (813 – 901mm and 901 – 994 mm). The LSI map of the study area was prepared based on FR values and WoE contrast values in ArcGIS 10.4 using the spatial analyst tools of raster calculator for both FR and WoE models. The LSI map in each model was reclassified into five landslide susceptibility classes of low, low, moderate, high and very high based on the natural breaks method of classification to produce the final landslide susceptibility maps. The performance of the final landslide susceptibility maps produced by FR and WoE models were validated using Landslide Density Index (LDI) and Area Under the Curve (AUC) values. The result revealed that the very low, low, moderate, high and very high values of the landslide susceptibility map are comparable with Landslide Density Index. In case of AUC, the rate curves were drawn using the cumulative percentage of the landslide in the Y-axis and cumulative percentage of map area in the X-axis. The results showed that both models exhibited very good performance. However, the FR model, which showed a success rate of 89.8% and a prediction rate of 88.2%, is better than the WoE model with a success rate of 86.5% and a prediction rate of 84.8%. This study confirmed that the bivariate statistical methods of FR and WoE models were found to be simple and effective models for landslide susceptibility mapping in the Guna mountainous chain of Simada area. The landslide susceptibility maps of the study area were prepared with a scale of 1:50,000 which can be used by civil engineers, geologists, designers and decision-makers for regional land use planning, site selection and landslide prevention and mitigation purposes.
Recommendation
The present study showed the importance of integrating various factors that are responsible for landslide occurrence in the study area. However, the quality of landslide inventory and the causative factor maps should be improved with good quality in time and space. Landslide in the study area has affected the local people who are living near to mountainous area, valleys and gorges. Their animals were died, houses and agricultural lands were destroyed and both social and economic activities were affected. Hence, besides preparing the landslide susceptibility maps of the area, suggesting the necessary preventive measures in the high and very high susceptibility classes is very essential in order to reduce the impact of future landslide hazards in the area. Hence, this study recommends planting trees & vegetation, providing proper drainage, applying gabion and check dam, relocating people and creating public awareness. In order to implement these remedial measures, further study on the geotechnical properties of soils and rocks should be conducted in this area.
Availability of data and materials
Rainfall data was collected from National Metrology Agency of Ethiopia. Topographic Map was purchased from Ethiopian Geospatial Information Agency. DEM data was freely available from http://gdex.cr.usgs.gov/gdex/ website.
References
Abay A, Barbieri G (2012) Landslide susceptibility and causative factors evaluation of the landslide area of Debresina, in the southwestern Afar escarpment, Ethiopia. J Earth Sci Eng 2:133–144
Abebe B, Dramis F, Fubelli G, Umar M, Asrat A (2010) Landslides in the Ethiopian highlands and the rift margins. African Earth science 56:131–138
Akgun A, Dag S, Bulut F (2007) Landslide susceptibility mapping for a landslide-prone area (Findikli, NE of Turkey) by likelihood-frequency ratio and weighted linear combination models. Eng Geol V 54:1127–1143
Akgun A, Turk N (2011) Mapping erosion susceptibility by multivariate statistical method: a case study from the Ayvalik region. NW Turkey Computers & Geosciences, Turkey
Akgun AA (2012) Comparison of landslide susceptibility maps produced by logistic regression, multi-criteria decision, and likelihood ratio methods: a case study at İzmir, Turkey. Landslides 9:93–106
Aleotti P, Chowdhury R (1999) Landslide Hazard assessment: summary, review and new perspectives. Bull Eng Geol Environ 58:21–44
Ayalew L (1999) The effect of seasonal rainfall on landslides in the highlands of Ethiopia. Bull Eng Geol Environ 58:9–19
Ayalew L, Yamagishi H (2005) The application of GIS based logistic regression for landslide susceptibility mapping in the KakudaYahiko Mountains Central Japan. Geomorphology 65(1):15–31
Baharin A, Farshid S, Javad M, Barat M (2014) Using Frequency Ratio Method for Spatial Landslide Prediction. Res J App Sci Eng Technol. 7:3174–3180
Bai SB, Wang J, Lu G-N, Zhou P-G, Hou S-S, Xu S-N (2010) GIS-based logistic regression for landslide susceptibility mapping of the Zhongxian segment in the three gorges area, China. Geomorphology 115:23–31 https://doi.org/10.1016/j.geomorph.2009.09.025
Bui DT, Pradhan B, Lofman O, Revhaug I, Dick OB (2012) Spatial prediction of landslide hazards in Hoa Binh province (Vietnam): a comparative assessment of the efficacy of evidential belief functions and fuzzy logic models. Catena 96:28–40
Can, Nefeslioglu HA, Gokceoglu C, Sonmez H, Duman TY (2005) Susceptibility assessments of shallow earthflows triggered by heavy rainfall at three catchments by logistic regression analyses
Chen FW, Liu CW (2012) Estimation of the spatial rainfall distribution using inverse distance weighting (IDW) in the middle of Taiwan. Paddy Water Environ 10:209–222
Choi J, Oh H-J, Lee H-J, Lee C, Lee S (2012) Combining landslide susceptibility maps obtained from frequency ratio, logistic regression, and artificial neural network models using ASTER images and GIS. Eng Geol 124:12–23
Crozier MJ (1986) Landslides: causes, consequences & environment. Croom Helm Pub, London
Cruden DM (1991) A simple definition of a landslide. Bulletin of the International Association of Engineering Geology 43(1):27–29. https://doi.org/10.1007/bf02590167
Cruden DM, Varnes DJ (1996) Landslide types and processes. National Research Council, Washington DC
Dahal RK, Hasegawa S, Nonomura A, Yamanaka M, Dhakal S, Paudyal P (2008) Predictive modelling of rainfall-induced landslide hazard in the Lesser Himalaya of Nepal based on weights-of-evidence. Geomorphology 102:496–510
Dai FC, Lee CF, Ngai YY (2002) Landslide risk assessment and management: an overview. Eng Geol 64:65–87
Demir G, Aytekin M, Akgün A, Ikizler SB, Tatar O (2013) A comparison of landslide susceptibility mapping of the eastern part of the North Anatolian Fault zone (Turkey) by likelihood-frequency ratio and analytic hierarchy process methods. Nat Hazards 65:1481–1506
Dikau R, Brunsden D, Schrott L, Ibsen M-L (eds) (1996) Landslide recognition. Identification, movements and causes. Wiley, Chichester, p 251
Fayez L, Pham BT, Solanki HA, Pazhman D, Dholakia MB, Khalid M, Prakash I (2018) Application of frequency ratio model for the development of landslide susceptibility mapping at part of Uttarakhand state, India. Int J Appl Eng Res 13:6846–6854
Felicisimo ÁM, Cuartero A, Remondo J, Quirós E (2012) Mapping landslide susceptibility with logistic regression, multiple adaptive regression splines, classification and regression trees, and maximum entropy methods: a comparative study. Landslides 10:175–189
Gholami M, Ghachkanlu EN, Khosravi K, Pirasteh S (2019) 2018 Landslide prediction capability by comparison of frequency ratio, fuzzy gamma and landslide index methods. J Earth Syst Sci 128:42 https://doi.org/10.1007/s12040-018-1047-8 Indian Academy of Sciences
Girma F, Raghuvanshi TK, Ayenew T, Hailemariam T (2015) Landslide hazard zonation in Ada Berga district, Central Ethiopia – a GIS-based statistical approach. J Geom 90:25–38
Glade T (2003) Landslide occurrence as a response to land-use change: a review of evidence from New Zealand. Catena 51(3–4):297–314
Glade T, Anderson M, Crozier MJ (eds) (2005) Landslide Hazard and Risk. https://doi.org/10.1002/9780470012659
Guzzetti F, Mondini AC, Cardinali M, Fiorucci F, Santangelo M, ChangM KT (2012) Landslide inventory maps: new tools for an old problem. Earth Sci Rev 112:42–66 Elsevier
Hong H, Xu C, Bui DT (2015) Landslide susceptibility assessment at the Xiushui area (China) using frequency ratio model. Procedia Earth and Planetary Science 15:513–517
Hutchinson JN (1989) General report: morphological and geotechnical parameters of landslides in relation to geology and hydrogeology. International Journal of Rock Mechanics and Mining Sciences & Geomechanics Abstracts 26(2):88. https://doi.org/10.1016/0148-9062(89)90310-0
Kanungo D, Arora M, Sarkar S, Gupta R (2009) Landslide susceptibility zonation (LSZ) mapping-a review. J South Asia Disaster Stud 2:81–105
Kanungo DP, Arora MK, Sarkar S, Gupta RP (2006) A comparative study of conventional, ANN black box, fuzzy and combined neural and fuzzy weighting procedures for landslide susceptibility zonation in Darjeeling Himalayas. Eng Geol 85:347–366
Khan H, Shafique M, Khan M, Bacha M, Shah S, Calligaris C (2019) Landslide susceptibility assessment using Frequency Ratio, a case study of northern Pakistan. Egyptian J Remote Sensing Space Sci 22(1):11–24. https://doi.org/10.1016/j.ejrs.2018.03.004
Komac M (2006) A landslide susceptibility model using the analytical hierarchy process method and multivariate statistics in perialpine Slovenia. Geomorphology 74(1–4):17–28
Lee S (2005) Application of logistic regression model and its validation for landslide susceptibility mapping using GIS and remote sensing data. Int J Remote Sens 26(7):1477–1491. https://doi.org/10.1080/01431160412331331012
Lee S, Pradhan B (2007) Landslide hazard mapping at Selangor, Malaysia using frequency ratio and logistic regression models. Landslides. 4:33–41
Lee S, Talib JA (2005) Probabilistic landslide susceptibility and factor effect analysis. Environ Geol 47:982–990
Meten M, Bhandary NP, Yatabe R (2015a) Effect of landslide factor combinations on the prediction accuracy of landslide susceptibility maps in the Blue Nile gorge of Central Ethiopia. Geoenviron Disast 2:9 https://doi.org/10.1186/s40677-015-0016-7
Meten M, Bhandary NP, Yatabe R (2015b) GIS-based frequency ratio and logistic regression modeling for landslide susceptibility mapping of Debre Sina area in Central Ethiopia. J Mt Sci 12(6). https://doi.org/10.1007/s11629-015-3464-3
Mezughi TH, Akhir JM, Rafek AG, Abdullah I (2011) Landslide susceptibility assessment using frequency ratio model applied to an area along the E-W highway (Gerik-Jeli). Am J Environ Sci 7:43–50
Mohammady M, Pourghasemi HR, Pradhan B (2012) Landslide susceptibility mapping at Golestan Province, Iran: a comparison between frequency ratio, Dempster-Shafer, and weights-of-evidence models. J Asian Earth Sci. 61:221–236
Mondal S, Maiti R (2013) Integrating the analytical hierarchy process (AHP) and the frequency ratio (FR) model in landslide susceptibility mapping of shiv-khola watershed, Darjeeling Himalaya. Int J Disaster Risk Sci 4:200–212
Pamela, Sadisun IA, Arifianti Y (2018) Weights of evidence method for landslide susceptibility mapping in Takengon, Central Aceh, Indonesia. IOP Conference Series: Earth and Environmental Science, 118:012037. https://doi.org/10.1088/1755-1315/118/1/012037
Pan X, Nakamura H, Nozaki T, Huang X (2008) A GIS-based landslide hazard assessment by multivariate analysis landslides. J Jpn Landslide Soc 45(3):187–195
Pardeshi SD, Autade SE, Pardeshi SS (2013) Landslide hazard assessment: recent trends and techniques. SpringerPlus 2(1). https://doi.org/10.1186/2193-1801-2-523
Parise M, Jibson RW (2000) A seismic landslide susceptibility rating of geologic units based on analysis of characteristics of landslides triggered by the 17 January, 1994 Northridge, California earthquake. Eng Geol 58:251–270
Park S, Choi C, Kim B, Kim J (2012) Landslide susceptibility mapping using frequency ratio, analytic hierarchy process, logistic regression, and artificial neural network methods at the Inje area, Korea. Environ Earth Sci 68:1443–1464
Paulin L, Bursik G, Hubp M, Mejía JL, Aceves Quesada FLMP (2014) A GIS method for landslide inventory and susceptibility mapping in the Río El Estado watershed, Pico de Orizaba volcano, México. Nat Hazards 71:229–241
Peng L, Niu R, Huang B, Wu X, Zhao Y, Ye R (2014) Landslide susceptibility mapping based on rough set theory and support vector machines: a case of the three gorges area, China. Geomorphology 204:287–301 Elsevier B.V
Pham BT, Tien Bui D, Prakash I, Dholakia M (2015) Landslide susceptibility assessment at a part of Uttarakhand Himalaya, India using GIS–based statistical approach frequency ratio method. Int J Eng Res Technol 4:338–344
Pirasteh S, Li J (2017) Probabilistic frequency ratio (PFR) model for quality improvement of landslide susceptibility mapping from LiDAR-derived DEMs. Pirasteh Li Geoenviron Dis 4:19 https://doi.org/10.1186/s40677-017-0083-z
Pradhan B, Lee S, Buchroithner MF (2010) Remote Sensing and GIS-based Landslide Susceptibility Analysis and its Cross-validation in Three Test Areas Using a Frequency Ratio Model. Photogrammetrie-FernerkundungGeoinformation 2010(1):17–32. https://doi.org/10.1127/1432-8364/2010/0037
Rahmati O, Haghizadeh A, Pourghasemi HR, Noormohamadi F (2016) Gully erosion susceptibility mapping: the role of GIS-based bivariate statistical models and their comparison. Nat Hazards 82(2):1231–1258 https://doi.org/10.1007/s11069-016-2239-7
Regmi AD, Devkota KC, Yoshida K, Pradhan B, Pourghasemi HR, Kumamoto T, Akgun A (2013) Application of frequency ratio, statistical index, and weights-of-evidence models and their comparison in landslide susceptibility mapping in Central Nepal Himalaya. Arab J Geosci 7(2):725–742 https://doi.org/10.1007/s12517-012-0807-z
Regmi NR, Giardino JR, Vitek JD (2010) Modeling susceptibility to landslides using the weight of evidence approach: Western Colorado, USA. Geomorphology 115(1-2):172–187. https://doi.org/10.1016/j.geomorph.2009.10.002
Temesgen B, Mohammed U, Asfawosen A (1999) Landslide hazard on the Dabicho, Wondo genet area: the case of June 18, 1996 event. SENET: Ethiop J Sci 22(l):l27–l140
Temesgen B, Mohammed U, Korme T (2001) Natural Hazard assessment using GIS and remote sensing methods, with particular reference to the landslides in the Wondogenet area, Ethiopia. Phys Chem Earth Part C: Solar Terrestr Planet Sci (C) 26(9):665–615
Vakhshoori V, Zare M (2016) Landslide susceptibility mapping by comparing the weight of evidence, fuzzy logic, and frequency ratio methods. Geomatics Nat Hazards Risk. 7(5):1731–1752
Van Westen CJ (2002) Use of weights of evidence modeling for landslide susceptibility mapping. International Institute for Geoinformation Science and Earth Observation (ITC), Enscheda
Varnes DJ (1978) Slope movements: types and processes. In: Schuster, R.L. and Krizek, R.J. (eds.) Landslide analysis and control, National Academy of Sciences, Transportation Research Board Special Report 176, Washington, 11-33.
Wang Q, Li W (2017) A GIS-based comparative evaluation of analytical hierarchy process and frequency ratio models for landslide susceptibility mapping. Phys Geogr 38(4):318–337
Woldearegay K (2008) Characteristics of a large-scale landslide triggered by heavy rainfall in Tarmaber area, central highlands of Ethiopia. Geophys Res Abstr 10:EGU2008-A-04506 2008, SRef – ID:16077962/gra/EGU2008-A-04506
Woldearegay K (2013) Review of the occurrences and influencing factors of landslides in the highlands of Ethiopia. Momona Ethiop J Sci (MEJS) 5(1):3–31
WP/WLI - International Geotechnical Societies’ UNESCO Working Party on World Landslide Inventory (1990) A suggested method for reporting a landslide. Int Assoc Eng Geol Bull 41:5–12
Yalcin A, Bulut F (2007) Landslide susceptibility mapping using GIS and digital photogrammetric techniques: a case study from Ardesen (NE-Turkey). Nat Hazards 41:201–226
Yalcin A, Reis S, Aydinoglu AC, Yomralioglu T (2011) A GIS-based comparative study of frequency ratio, analytical hierarchy process, bivariate statistics and logistics regression methods for landslide susceptibility mapping in Trabzon, NE Turkey. CATENA 85(3):274–287 https://doi.org/10.1016/j.catena.2011.01.014
Ye C, Li Y, Cui P, Liang L, Pirasteh S, Marcato J et al (2019) Landslide Detection of Hyperspectral Remote Sensing Data Based on Deep Learning With Constrains. IEEE J Selected Topics Appl Earth Observ Remote Sensing 12(12):5047–5060. https://doi.org/10.1109/jstars.2019.2951725
Yilmaz I (2009) Landslide susceptibility mapping using frequency ratio, logistic regression, artificial neural networks and their comparison: A case study from Kat landslides (Tokat—Turkey). Comput Geosci 35(6):1125–1138
Acknowledgments
The first author would like to thank Dr. Kifle Woldearegay, Mr. Azmeraw Wubalem and Mr. Leulalem Shano for thier useful Comments and suggestions to improve this research work. He would also like to thank Mizan Tepi University for providing the scholarship opportunity to pursue his MSc study at Addis Ababa Science and Technology University.
Funding
Mizan Tepi University partially funded the first author’s MSc thesis research work.
Author information
Authors and Affiliations
Contributions
TM as a first author has mostly participated in the whole process of this research work including the field-work, data collection, database preparation and in compiling the results by himself. MM, as an advisor, commented in each phase of the research for further improvement. TM addressed the comments given from his advisor in terms of its scientific justification, methodological aspect and English correction before the final submission and finally the two authors approved this paper submission.
Corresponding author
Ethics declarations
Competing interests
The authors declare that we do not have any competing interests with any individual or organization.
Additional information
Publisher’s Note
Springer Nature remains neutral with regard to jurisdictional claims in published maps and institutional affiliations.
Rights and permissions
Open Access This article is licensed under a Creative Commons Attribution 4.0 International License, which permits use, sharing, adaptation, distribution and reproduction in any medium or format, as long as you give appropriate credit to the original author(s) and the source, provide a link to the Creative Commons licence, and indicate if changes were made. The images or other third party material in this article are included in the article's Creative Commons licence, unless indicated otherwise in a credit line to the material. If material is not included in the article's Creative Commons licence and your intended use is not permitted by statutory regulation or exceeds the permitted use, you will need to obtain permission directly from the copyright holder. To view a copy of this licence, visit http://creativecommons.org/licenses/by/4.0/.
About this article
Cite this article
Mersha, T., Meten, M. GIS-based landslide susceptibility mapping and assessment using bivariate statistical methods in Simada area, northwestern Ethiopia. Geoenviron Disasters 7, 20 (2020). https://doi.org/10.1186/s40677-020-00155-x
Received:
Accepted:
Published:
DOI: https://doi.org/10.1186/s40677-020-00155-x
