- Research
- Open access
- Published:
Rural earthen roads impact assessment in Phewa watershed, Western region, Nepal
Geoenvironmental Disasters volume 3, Article number: 13 (2016)
Abstract
Background
This work describes current research being conducted in the Phewa watershed, near Pokhara in Nepal’s Middle hills, a moist sub-tropical zone with the highest amount of annual rainfall in Nepal (4,500–5,000 mm). The main purpose of this study is to focus on the increase and impact of rural earthen road construction in the Phewa watershed as part of land use changes over 30 years in one of Nepal’s most touristic regions.
Research methods were interdisciplinary and based on a combination of remote sensing, field observations and discussions with community members. The study compared 30 year-old aerial photos with current high resolution satellite images to detect changes in the watershed road network. Secondly, 42 % of the watershed’s roads (138 km) were surveyed in order to inventory and quantify shallow landslide events. Using an erosion-characteristics grid, their main features were measured (location, size, type and dimensions of damaged areas, etc.) and a Geographic Information System data base was created. We then estimated economic impacts of these events in terms of direct agriculture lands losses and road maintenance.
Results
Results of the remote sensing analysis demonstrate that the road network increase is following an exponential trend, which enables us to predict future watershed road network scenarios. Field work investigations have demonstrated that unplanned road excavations are producing mainly embankment shallow planar soil slides and/or gullying which primarily affect roads themselves, wiping them out and blocking vehicle circulation, and secondly, destroying or burying agriculture lands. Along the 138 km surveyed, we calculated an amount of soil material released of about 70,000 cubic meters, which amounted to 99 cubic meters per kilometer annually. Of 179 cases of roadside erosion processes sampled, about 85 % directly impact roads or agricultural lands.
Conclusion
The current mode of road construction which is currently occurring in Nepal is largely related with erosion and shallow landslide processes. Considering the exponential growth of rural earthen road networks, we would expect an increase of sediments released by roads and serious consideration must be taken if roads continue to be made without more careful methods. Through simple technologies using low cost and local resources along the lines of ‘green road’ or ‘eco-safe road’ approaches, it may be possible to reduce the impacts of rural road construction.
Background
Nepal has the greatest altitude variation on earth which ranges from 60 to 8,848 m above sea level. The high mountains are the result of the collision between the Indian tectonic plate and the Eurasian tectonic plate (Avouac, 2015). The uplift is currently active and makes the country prone to earthquakes. The 147,000 square kilometers of this landlocked mountainous country are divided into five physiographic units from north to south: the high Himalaya, high mountains, the middle hills region, the Churia or Siwalik range and the Terai region in the plains (Fig. 1). About 80 % of Nepal is mountainous or hilly and 20 % are plains area of Terai, which are located at the northern Ganga Basin (Agrawala et al., 2003). With about 200 km separating the plains area of Terai (south) from the high Himalayas (north), the country presents great topographic diversity. The country therefore has high climate and vegetation diversity which varies from tropical in the Terai to High-mountains climate (snow and ice) in the north (Agrawala et al., 2003). Annual rainfall varies from 1,000 to 5,000 mm. As the middle mountain range (around 2000 m.a.s.l) are the first mountain barriers for the monsoon clouds moving north from the Bay of Bengal, around 80 % of this precipitation occurs during this season, which lasts from June to September (MoHA, 2009). Poor rock mass conditions makes Nepal’s slopes prone to fluvial and landslide erosion. Moreover, geological context of the Middle hills region is dominated by metasedimentary rock with metamorphosed granites in upper part and, carbonate and clastic sedimentary rocks, which are weak (Hashimoto et al. 1973).

Nepal’s physiographical regions, and Phewa watershed location and boundaries as considered in the study. Note on the bottom map the erosion areas measured along the surveyed roads. The surveyed roads network makes part of the total roads network (Source for the top map: Forest Resource Assessment Nepal, 2015; Source for the bottom map: Pleiades Satellite Imagery, 2013)
According to the World Bank (2013), the road network has tripled in Nepal in the past decade. In 2013, the Strategic road network (SRN), which is managed at the central level, was approximately about 11,000 km while the Local Road Network (LRN), which is managed at local level, was about 60,000 km (World Bank, 2013). Roughly half of the SRN and more than 95 % of the LRN is unpaved, giving a paved network of 8,000 km only or 11 % of the total road network (World Bank, 2013). The SRN road density increased from 3.22 km of roads per 100 km2 in 1998 to 8.49 km of roads per 100 km2 (DoR, 2015). According to the World Bank (2013), the Nepal road density is actually high as compared to other mountainous countries and largely due to the trend in the past decade of opening up new roads in Nepal. The government has placed a great emphasis on developing the roads and the transportation infrastructure as a real means of development for the rural population (World Bank, 2013).
Moreover, according to Sudmeier-Rieux (2011), the result of the 2008 Decentralization Act produced authority and budgets transfer to local governments. Consequently, rural road construction has become a priority for the main village and district authorities, in other words the Village Development Committees (VDCs) and the District Development Committees (DDCs) (World Bank, 2013). Many communities are collecting their own funds to rent bulldozers and build rural roads without proper technical and geological expertise (Das Mulmi, 2009). The road construction boom and lack of enforcement of government regulations has led to a low quality Nepal rural network, with roads which often do not provide year round access (World Bank, 2013). Slope cut during rural earthen roads construction certainly affect the frequency of shallow and in some cases larger landslides and local soil erosion/deposition processes, although the exact percentage of road induced shallow landslides is unknown (Fort et al., 2010; Furniss et al., 1991). This human-induced phenomenon directly impacts communities and infrastructure (Sudmeier-Rieux, 2011).
In 1979, Laban demonstrated that 5 % of Nepal’s landslides (above 50 m2) were induced by roads or trails and formulated a serious warning about this high value since the percentage of the land covered by roads network was at the time very small. The road and transportation network has clearly increased dramatically over the past three decades and we should expect a drastic increase of road-induced landslides in Nepal since 1979 (Laban, 1979; Petley et al., 2007; Fort et al., 2010). Green roads, or the use of simple engineering structures for drainage and slope stabilization, have been promoted in Nepal for several decades (Das Mulmi, 2009). They are characterized by the use of locally available deep-rooted grass species based on a participatory approach from planning to implementation, and environment consideration.
The Phewa watershed is actually an area that has experienced an exponential increase of rural roads network (as it will be developed farther in this paper) partly due to the presence of the adjacent town of Pokhara and the presence of the Phewa Tal, one of the most prominent lake in Nepal. Both have contributed to attract people for agriculture and tourism. Therefore, we selected this watershed as the study area to quantify roadside erosion events.
The objective of this paper is to share observations on the current state of rural earthen roads and their impacts in terms of an acceleration of erosion rates and related costs for road maintenance and agriculture land losses in the Phewa watershed. Sedimentation rate and costs results could provide a basis for further studies on conventional versus green road construction.
Description of the study area
Phewa watershed is located in the western part of the Pokhara valley of Kaksi District in the Western Development Region of Nepal. The watershed lies within latitude of 28° 11’ 41.7” to 28° 17’ 26.0” north and longitude of 83° 47’ 53.2” to 83° 58’ 04.3”east. It covers an area of about 111 square kilometers (Fig. 1).
The outlet of the Phewa Lake is situated at 784 m above sea level (Sthapit and Baila, 1998) where the highest point is marked by the Panchase ridge summit at 2517 m.a.s.l. The confluence of two main tributaries Sidhane and Adheri, form the Phewa river drains into the Phewa lake. These two sub-watersheds cover 24.5 and 28.4 % respectively of the total watershed area (Sthapit and Baila, 1998). According to our data, in 2013, Phewa lake covered 3.3 % of the total watershed area. This figure is similar to recently published data, which determined the lake’s surface to be 3.96 % in 2013 (Rimal et al., 2015). The capacity of the lake was estimated as 42.18 million m3 in 1998, and the annual average sedimentation rate in the lake was about 180,000 m3 (Sthapit and Baila, 1998). If a constant rate is considered, 80 % of the lake’s storage will be silted up in about 190 years according to the same authors. Moreover, Phewa Lake is also experiencing accelerated eutrophication, land encroachment, and massive invasion of water hyacinth and exotic carp fish species (FEED, 2014; JICA, 2002).
According to the 2012 land use classification based on a 2012 RapidEye satellite image (5 m resolution) undertaken by UNEP (Sharma et al., 2013), land use in Phewa watershed was comprised of 41 % productive (agriculture/grassland terrain), 49 % forest (trees and bushes), and 5 % water bodies (lake, river and swamp area), 3 % built up area, 1 % sand area (near rivers and lake). The area was part of a watershed land use management program, which started in the 1970s (Fleming and Puleston Fleming, 2009). As far as the difficulties to reduce erosion are concerned, the program focused on the conversion of “critical landscapes” (Fleming and Puleston Fleming, 2009: 38), such as degraded shrubs, grazing land and unmanaged forests, to managed community forests or managed pasture. According to the authors, watershed forest land increased from 28 % to 36 % between 1978 and 2006 while the terraced arable land remained constant. Forests managed by Community Forest User Groups exceeded 60 % of total forests in the watershed in 2006. Forest (and bush) cover steeper areas, possibly due to improved community forest development in the watershed, and could play a role in the protection of soil from mass movement and failures (Papathome Koehle and Glade 2013).
The watershed lithology is compounded by intensively weathered rocks and weak soils, highly prone to erosion and shallow landslides (Agrawala et al., 2003). According to the geological map made in 1998 by the Department of Mines and Geology of Nepal in cooperation with the Bundesanstalt für Geowissenschaften und Rohstoffe - Federal Institute for Geosciences and Natural Resources, Hannover, Germany (Sikrikar et al., 1998), the watershed lithology is mostly gritty phyllite (46 % of the total area) and fine grain massive quartzite (25 % of the total area), in the south-western part of the watershed (Harpan sub-watershed). The watershed is also comprised of colluvial in homogeneous deposits (silt, sand, gravel and boulders) and debris flow deposits. The flood plain is mainly gravel, sand, silt and clay deposits.
The watershed climate is based on annual monsoon events, which bring more than two thirds of the annual rainfall between June to September. This season is characterized by intense rainfall; events of 300 mm in 24 h are not uncommon in this area (MoHA, 2009). Between 1982 and 2012 the mean annual rainfall at Lumle meteorological station (located at North West of the watershed, 1740 m.a.s.l.) was about 5,506 mm. At the Pokhara Airport meteorological station (827 m.a.s.l.), it is about 3,875 mm. These extreme natural events contribute of the natural degradation of steep terrain including the triggering of landslides or flash flooding.
Methods
Data available and field investigation
The present survey was conducted through data available and data field collected during November 2014 campaign.
Available data:
-
▪ Digitalized topographical map of 1996 from the Government of Nepal, NGIIP, Survey Department, Ministry of Land Reform and Management.
This digitalized topographical data set is directly usable on a Geographic Information System (GIS) program. The data are compounded by Shapefiles of transportation and hydrographic networks, administrative and built zone boundaries, 20 m topographical contours lines and land cover areas.
-
▪ 1979 aerial photography and 2013 satellite images.
The 2013 images come from Pleiades Satellite Imagery and are of 2 m resolution for the 4 bands (multispectral) and of 0.5 m resolution for the panchromatic. The 1979 aerial photos come from the Department of survey of the Government of Nepal. Both fully cover the watershed.
-
▪ 1998 Geological map of Pokhara valley published by Department of Mines and Geology in cooperation with Bundasanstalt für Geowissenschaften und Rohstoffe - Federal Institute for Geosciences and Natural Resources, Hannover, Germany (Koirala et al., 1998).
-
▪ 2012 Land use base map prepared by UNEP for the Ecosystem-based Adaptation in Mountain Ecosystem project in Nepal. The classification was undertaken on a 2012 RapidEye satellite image (5 m resolution) using segmentation and object classification method on the eCognition software tool (Sharma et al., 2013). Forest areas, agriculture areas, and water body and sand areas were classified.
During field work in November 2014, about 42 % of the total watershed roads network (138 km) was surveyed to detect and inventory erosion processes directly induced by road construction. We created an erosion-characteristics grid to characterize and classify the observations and measurements undertaken during field work. All these data were gathered in a Geographic Information System (GIS) project using ArcMap 10.2 (ArcGis program) in the projected geographic coordinate system WGS 1984 UTM, Zone 44 North.
Road network detection and comparison for the period 1979–2013
Three sources of data enabled to detect and compare changes over the period 1979–2013 in the Phewa watershed road network. The 1979 aerial photographs were digitalized and geo-referenced by our care using the program ENVI 5.0. Roads were manually detected respectively on the 1979 aerial photos and on the 2013 satellite images. We define roads as the transportation ways for vehicles in general (black top and earthen roads) but earthen roads are clearly the major type of transportation way in the watershed (both in 1979 and 2013). Shapefiles from the 1996 digitalized topographical map provided a detailed overview of the entire road and path network, which was re-classified to differentiate the two.
The main goal of this remote sensing work is to compare the length of the road network over the three past decades in order to characterize road network trends of the watershed.
Road induced erosion and damaged area events inventory
About 138 km of the watershed’s roads were surveyed over 3 weeks of field work to measure main features of the erosion processes (shallow landslides, gullies) induced by road construction (see Fig. 1).
We directly separated this inventory work into three different general classes (Fig. 2):

General architecture of the erosion-characteristics grid summarizing field’s measurements. The three main classes - erosion events, surveyed roads and damaged area - are inter-related and are characterized for each point measured
-
1)
Road-induced erosion events: we measured their position along the road and elevation using a Geographic Positioning System (GPS), their dimensions using a laser distance meter; we also noted failure event activity/age, the material involved, etc.
-
2)
Classification of the road through observations and discussions with community members.
-
3)
Potential damaged areas due to road-induced erosion events. Two damaged areas were considered: the road itself that could be wiped out or blocked, and agriculture land that could be buried or destroyed. Each one represents an economic impact and, in some cases, could injure persons living in the watershed. Nevertheless, not all the events directly affected the surrounding environment, infrastructure or persons.
We then created an Excel sheet summarizing the field work measurements. One important step of the inventory work was to measure relevant dimensions of each failure event with a laser distance meter to propose volumetric estimation using basic 3D geometric shapes (see further for the volume estimation methodology). For each damaged area, the road deposit volume and the agriculture land lost surface were also characterized.
Moreover, by representing event GPS location points (as Shapefiles) in the GIS project, it was possible to record some relevant information that could be directly integrated in the database. For example, we noted the 2012 land use and slope angle for each landslide event point location.
The main idea of creating an erosion-characteristic database paired with a GIS project of the Phewa watershed was to be able to generate statistics about simple volume estimations of the road side events.
Classification details
Fluvial and hill slope erosion processes were inventoried, and differentiated considering their main conditioning factor (natural or human induced). The landforms identified differ in type, shape, road location and potential damages involved.
The following list/sub-sections details each relevant parameter of the erosion-characteristics grid:
-
1.
Road-induced erosion events
Event type: The mass balanced method of excavation (‘cut-and-fill’) is commonly used for road construction on hill slope (Keller and Sherar, 2003; Cornforth, 2005). The ‘cut-and-fill’ design (Fig. 3) could be at origin of landslides and road embankment failures: “an approximately equal cut-and-fill cross-section can (i) undermine the upper slope, causing it to fail, (ii) overload the downhill slope, causing it to fail, or (iii) cause the entire slope to become an active landslide.” (Cornforth, 2005: 12). Following the definition of Hungr et al. (2013), roadside erosion events observed in Phewa watershed are commonly shallow and planar soil slides. Upper and lower roadside embankments can be affected. Moreover, gullies induced by runoff, especially during monsoon, on the ‘cut-and-fill’ design road embankments are also an erosion phenomenon observed in the watershed. Erosion events were classified as follows (Fig. 3):
Fig. 3 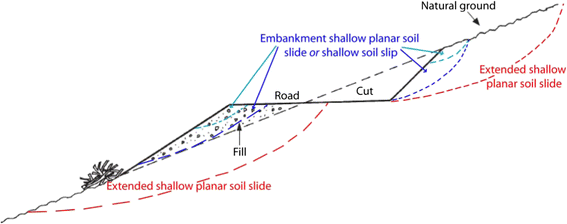
Cut-and-fill design of road construction and related slides and failures events potentially occurring in Phewa watershed (modified from Keller & Sherar, 2003)

-
a.
Embankment shallow planar soil slide or shallow soil slip: Shallow soil volume sliding along an inclined slip and planar surface. They are characterized by small size and thickness, with volumes up to few cubic meters (Crosta et al., 2003). They are occurring directly on the upper or lower road embankment.
-
b.
Extended shallow planar soil slide: Corresponds to a larger shallow planar slide and doesn’t occur only on the roadside embankment but also on the surrounding hillsides. They are characterized by length up to 20 m and width up to 10 m, and involve larger quantity of material. As far as is difficult to be sure to consider road as the driver of this larger event, the few cases measured here were clearly triggered by the roads.
-
c.
Gully: In some cases, road construction affects water drainage that could cut upper or lower road embankments and form gullies. Moreover, this phenomenon could be at origin of channelization in the lower slopes; it is thus considered to be gully erosion induced by road construction. The consequences are deposits produced by bedload and/or small debris-flows.
Activity
This parameter is important and is mainly signaled by the age of deposits. Numerous signs indicate activity, such as the rock deposit patina and weathering, if the deposit is re-vegetated, etc.
-
▪ Recent: less than 2 years;
-
▪ Medium: between 2 and 5 years;
-
▪ Old: more than 5 years.
Event volumes
The volume of material failures was estimated as the volume of sediment removed assuming interpreted ‘pre erosional’ land surface and simple geometric 3D erosion shapes (Cossart & Fort, 2008; Campbell & Church, 2003).
The erosion event type is, defined as a horizontal shape in two dimensions of the erosion area used as base to calculate the volume. The formulae used to estimate erosion volume are based on the basic dimensions measured in the field with a laser distance meter (length, width and thickness). For example, shallow soil slide events are largely defined by a parallelepiped volume of material of a given width (W), length and thickness sliding along a plane (L); in this case the 2D base shape is a parallelogram. Figure 4 illustrates the flowchart detailing the volume calculation process.

Volume estimation process for erosion events. L, W and T correspond respectively to length, width and thickness of the event and are illustrated in the Fig. 5
The list below details the volumes estimation method according to each event type. Basic dimensions and 2D base shapes are illustrated by Fig. 5.

Basic dimensions as measured on field used to determine: (a) embankment shallow planar soil slide event volumes according to the two types of base shapes, (b) gully erosion event volumes
-
▪ Embankment shallow planar soil slide or shallow soil slip: The 2D base shape could be of 2 types: semi-ellipse or parallelogram. Volume is calculated as the product of the base shape area (depending on length and width parameters) by the thickness of the sediment volume removed.
-
▪ Gully: The 2D base shape section is defined here as a semi-ellipse (similar to the U-shape section of a gully) and volume estimation is the product of the surface and length of the gully.
-
▪ Extended shallow planar soil slide: When it was difficult to measure the slide thickness on the field, we used an empirical relation (Hovius et al., 1997):
V = 0.05 × S1.5 (with S the landslide surface and V the landslide volume).
Slide surface could be easily approximated as an ellipse depending on length and width measured during field work.
Slope
Contour lines of the 1996 digitalized topographical map were used to create a raster DEM 30 m resolution through interpolation tools on ArcGis 10.2 (based on discretized thin plate spline techniques). The DEM has enabled then to compute slope angle values. Due to the small DEM resolution, the slope layer represents only the angle value of the regional slope of the watershed.
We considered 4 slope classes: [0°; 13°], [13°; 27°], [27°; 39°] and [39°; 90°].
Lithology
This parameter was processed by joining the 1998 Geological Map, digitalized and vectorized to be available on a GIS program, with event points shapefiles.
Land use type
This parameter was processed by joining the 2012 Land Use layer with event points shapefiles.
Surveyed roads
A large part of the watershed road was traced using a Global Positioning System (GPS) during the field work and then classified according to the observations and discussion with the community members. Each event also contained road information according to its location (as it is classified).
Surface type:
-
▪ Paved road: Black top surfacing.
-
▪ Earthen road: Earth surfacing.
Road access:
-
▪ Drivable: By a 4 wheel drive car.
-
▪ Not-drivable: Because of a bad road surfacing or deposit/failure cutting the road.
Road maintenance:
-
▪ Maintained: Shows numerous signs of maintenance (protection and stabilization infrastructure, drainage system, etc.). However, this does not necessarily reflect how well the road is maintained.
-
▪ Unmaintained: The road is left in its actual state.
Damaged areas
Characterizing the damaged area was undertaken mainly to estimate direct costs of the road maintenance and the agriculture land losses according to several scenarios.
-
A.
Affected roads
Type of damage:
-
a.
Deposit: Burying of road surface by up-slope soil material. Maintenance will consist of removing deposits from the road.
-
b.
Cut in road shoulder: Road surface failure due to a collapse/slip of the lower road embankment. Maintenance will consist of filling in the eroded part with soil deposits.
Volumes to remove or repair: The volumes that are removed or used to repair are estimated as parallelepipeds of given length, width and thickness. They were measured during field work. In some cases, the full volume of the involved material is considered to be removed; this depends largely on the observations undertaken on field (Fig. 6).
Fig. 6 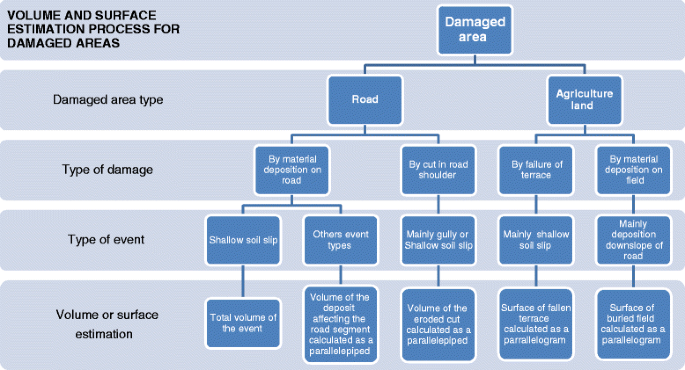
Volume and surface estimation process for damaged area. Note that simple shapes, such as parallelepiped and parallelogram, are used to estimate volumes and surfaces
This parameter is directly used to estimate the direct cost of maintenance.
-
a.
-
B.
Affected agriculture land
Type of damage:
-
a.
Failure: Failure of terrace areas destroying crop area due to a collapse/slip of the upper road embankment.
-
b.
Deposit: Burying of crop areas by soil material coming from upper-sides.
Crop type: Type of crop cultivated before the damages occurred.
Dimension of agriculture surface lost: The productive crop surface lost is considered as parallelogram of a given length and width measured during field work (Fig. 6).
This parameter is directly used to estimate the direct cost of agriculture lands losses.
-
a.

The flowchart (Fig. 6) illustrates a simple way to estimate roadside volume to remove or repair and agriculture surfaces directly affected by road induced erosion events.
Results
Slope angle distribution of the watershed
We have divided the Phewa lake in four classes according the slope; each class has a different land use (Fig. 7): The first class [0–13 °] corresponds to the flood plain, fluvial terraces, distal parts of alluvial fans and the lake. Most of the settlements, schools, and agriculture and grazing lands, occupy this area, accounting for 25 % of the total watershed and part of Pokhara city, which lies in the watershed. The main reason for the land use of this sector is the soil conditions, better ability for terracing, water drainage, and access to roads. The second class [13°–27°], also corresponds to low relief area. It is primarily covered by agriculture terrains and settlements whereas the third class [27°; 39°] is mostly covered by forest. Finally, 3 % of the total watershed area is steeper than 39°; this area corresponds to rock slopes with low vegetation and steep terrain covered by forest.

Slope classes distribution (see below for calculation) according to the 2012 land use type. It has been standardized to take into account the same proportion of surface covered by each slope class area in relation to the total watershed area; in that way, land use type area for a given slope classes based on the same surface calculation and so, we represent here the weight of the different land use types for each slope class in the same proportion (Source: 2012 Land use base map prepared by UNEP for the Ecosystem Based Adaptation in Mountain Ecosystem project in Nepal. The classification was undertaken on a 2012 RapidEye satellite image (5 m resolution) using segmentation and object classification method on the eCognition software tool (Sharma et al., 2013))
It is important to note that the 5 m resolution of the 2012 RapidEye satellite image allowed a rough classification of the land use type of the watershed. Boundaries between two classes are not well defined. Also, an isolated element of a land use type could be not detected. However, in this case, the 30 m DEM that has allowed computing only the angle value of the regional slope of the watershed, it is relevant to assess the slope angle distribution in relation to this rough land use classification.
Road network increase and trends
In 1979, there were no black top roads in Phewa watershed whereas in 1996 about 5 km of the road network was paved. A classification between earthen roads and black top roads for the year 2013 is based on the road survey conducted during field work, where most of black top roads of the Phewa watershed (about 10 km) were surveyed. In addition, we included a section of the Pokhara road network belonging to the Phewa watershed to reach a total black top road network length of about 18 km for the year 2013. The total length of the 2013 earthen roads in the watershed was calculated as the difference between the total number of transportation ways detected on the 2013 satellite image and the black top roads length calculated as explained previously. Following Fig. 8, the watershed black top roads length increase is more defined by a 2nd order polynomial relation whereas the earthen roads length grew exponentially. We then focused only on the earthen roads network, as we will demonstrate further earthen roads are the main trigger of erosion events in the watershed.

Increase of (a) black top roads network length and, (b) earthen roads network length in Phewa watershed over the past 3 decades. The horizontal scale starts in the year 1979 (0 corresponds to the year 1979). Note that for the black top roads increase case (plot (a)), the growth is defined by a 2nd order polynomial trend. Only 17 km of black top roads built more than 30 years illustrates well the few considerations in developing a paved road network in Nepal. For the earthen roads increase case (plot (b)), the growth is well defined by an exponential trend and clearly illustrates the earthen roads construction “boom” occurring in Nepal over the past decade
The watershed earthen roads network length has considerably increased over the past three decades, from about 23 km in 1979 to 310 km in 2013, due to the new earthen roads boom in Nepal (Fig. 9). The increasing trend is clearly defined by an exponential curve and we can consider the trend line (in Fig. 8, plot (B)) as representative of the earthen roads network length vs year, as the correlation coefficient is close to 0.95.

1979, 1996 and 2013 roads networks in Phewa watershed. Note that the watershed roads networks length has increased significantly over the period of 1979–2013
Nevertheless, the transportation network growth model would be better defined by a logistic curve as the territory is physically limited and the road network length will therefore tend to a maximum value. The model would be therefore characterized by an exponential trend reaching an asymptote corresponding to the maximum value. Aderamo (2013) has also characterized growth of cities road networks (Ilorin, Nigeria) using aerial photos and images and he showed that it conforms to a logistic curve. However, to make earthen roads length predictions for the next decade, we assume here that in the short run, the growth trend will not have reached its maximum value.
Regarding the total road network growth according to slope angle classes (Fig. 10), the curve fitting of the road construction indicates the largest growth coefficient (superscript of the exponential relation) for the range [27°; 39°], which correspond to medium steep areas. Then, follow the ranges [13°; 27°] and [0°; 13°], which correspond respectively to the low steep areas and the flood plain. Both show a quite similar road construction increase coefficient. Moreover, the largest increase quantitatively occurs for the range [13°; 27°]. This means that the major road network length is located in low steep areas and in the flood plain, with respectively 54 and 36 % of the total watershed road network. This observation is clearly related to the land use type in these slopes classes; agriculture activity and settlements location have played an important role in developing transportation infrastructure in that areas. If the road network growth of these three slope classes follows an exponential trend, we can note that results for the range [13°; 27°] are not really relevant as the correlation coefficient is low. Finally, road length growth in the range [39°; 90°] is better defined by a linear relation and is little represented in the total watershed road network.

Total roads length increase trends according to slope classes. The horizontal scale starts in the year 1979 (0 corresponds to the year 1979)
Erosion events and damaged areas: from inventory to statistics
Along the 129 km of earthen roads surveyed,Footnote 1 179 erosive landforms induced by road construction were identified. In 155 cases, the road network was washed out partially or totally and in 21 cases, agriculture lands were affected. Most of the shallow landslides identified locate in the northern slope of the watershed (Fig. 11), where the road is cutting perpendicularly a steeper part of the watershed. In the south, fewer roads were built up, but also fewer surveys were carried out. The contrasting landslide occurrence between north and south reflects the link between road construction and shallow landslide occurrence.

General view of Phewa watershed mapped with erosion type (with illustrations) measured on roads surveyed during 2014 field work. Extended and embankment shallow planar soil slides and gully are the three type of road-induced erosion events observed in the watershed
Results focus on counting the number of landforms in addition to estimating the volume relation between erosion events, damaged areas and surveyed roads, first for the total area of the watershed and, secondly according to zonal parameters: slope angle classes, lithology and land use type.
Main statistical results
Most of the roads on the Phewa lake are earthen roads (Fig. 12 and Table 1). Along them, landslides and gullies developed in relationship with the cut of slopes during road construction and when by diverting run off. Moreover, in the same way, the majority of cases measured occur on the unmaintained road segment, wiping it them out and leaving the road undrivable in more than two third of cases. Nevertheless, about the half of the network surveyed clearly showed signs of maintenance. Given that the watershed research primarily targeted accessible roads by jeep, the remaining watershed road network would obviously being worse state and certainly unmaintained, that means that the roads surveyed during field work may be not representative of the total watershed roads network.

Kilometric distribution of erosion events and damaged area cases along the surveyed roads. Note that to avoid the length factor, the number of cases is standardized in the distance unit, e. g. by kilometer of road. Results are clearly linked with the state of roads; erosion events (as defined in the methodology section) and induced damage areas (e.g. the road itself and the agriculture lands) cases occur most of time along unmaintained earthen roads
Table 2 and Fig. 13 summarize total results of erosion events volume, roadside maintenance volume and agriculture land lost surface amounts. It also classifies these values according to type and activity of erosion events. Along the 129 km of earthen road surveyed, an estimated 70,133 m3 were directly released along roadsides. Of this total amount, 28 % or 19,671 m3 of material deposited need to be maintained and 37,567 m2 of agriculture land were buried or destroyed.

Distribution of erosion events volume released, roadside maintenance volumes and agriculture land lost surface according to event parameters along 42 % of the watershed’s road network
Extended shallow planar soil slide is the mechanism releasing the most of material volume even if the number of cases measured is lower in relation to embankment shallow planar soil slide or shallow soil slip (13 cases detected for extended shallow planar soil slide against 150 cases for embankment shallow planar soil slide or shallow soil slip). This observation could be explained by the fact that extended shallow planar soil slides are clearly a much larger phenomenon than the fewer embankment slips defined as embankment shallow planar soil slide or shallow soil slip and involve greater quantities of soil material. Moreover, 16 cases of significant gully erosion were detected and involved lower quantities of soil material. Nevertheless, regarding the damaged areas, embankment shallow planar soil slide or shallow soil slip are clearly responsible for most of the road maintenance needed and also represent a large part of agriculture land losses, especially in terraces subject to failure processes but also due to land down-slope buried by deposits. Extended shallow planar soil slides are also playing an important role in burying agriculture lands.
More erosion events were detected in the medium range activity than in the recent one, as 3 years are included in medium range while 2 years are included in the recent range. Nevertheless, total volume released for the medium and the recent ranges activity, respectively led back to 1 year, give an amount of about 12,500 m3/year for each one; this result traduces that the event activity parameter is relevant for the recent and medium ranges. However, due to high land use changes and quick vegetation growth, old range activity total volume is not relevant due to the difficulty in detecting older events. Otherwise, the damaged areas cases were mostly induced by recent events.
Amounts have been estimated for the total watershed roads network: along 310 km of earthen roads, 166,982 m3 of material is released, 46,835 m3 need to be maintained and 89,445 m2 of agriculture lands is lost. These values let assume than road-induced erosional conditions are well homogenous along watershed roads. As mentioned above, the remaining watershed roads which were not been surveyed during the field work are in worse state than the surveyed one: this observation could significantly increase erosion events volume and damaged areas cases.
Assuming homogenous erosional conditions along earthen roads in the watershed, we can estimate kilometric indexes for erosion events volume, roadside maintenance volume and agriculture land lost surface. Therefore, this human-induced phenomenon is responsible for releasing 544 m3of soil per kilometer of earthen road. To take into account the time dimension, we can use totals estimated according to the event activity parameter: about 198 m3 per kilometer of earthen road is released over 2 years (total ‘recent’ events volume per 129 km), which gives an annual volumetric erosion rate per kilometer of about 99 m3.km−1.year−1. The ‘recent’ value was used to calculate the rate because it is considered as the most exhaustive events volume measurements in the watershed. The same assumptions was used to determine annual roadside maintenance volume per kilometer and annual agriculture land lost surface per kilometer which amounts respectively to 39 m3.km−1.year−1 and 86 m2.km−1.year−1. This Figure is comparable to the Figure given by Validya (1985, 1987) of 55 m3.km−1.year−1 of debris produced by rural earthen roads (cited by Sharma and Maskay, 2009).
Influence of various parameters on roadside erosion and damaged areas
Additional analyses were undertaken on key watershed parameters related to erosion events and damaged areas (measured along 42 % of the watershed roads network). The study therefore focused on the lithology, on the 2012 land use and on slope angle classes with the goal to calculate the total erosion events volume, the total roadside maintenance volume and the total agriculture land lost surface per classes of slope, per classes of land use and per classes of lithology. However, it is likely that greater volumes or surface value are to be found on a larger area of detection. Similarly, we standardized the erosion events and maintenance volumes, the surface areas lost and the road length by the surface of class of detection. Finally we plotted the ratio volume/km or surface/km for each class in order to represent only the influence of the parameter, not taking into account the surface value of detection.
-
a.
Influence of lithology
Erosion events occur in colluvial soil and in the fine grained and massive quartzite formations (which are located in the in Harpan sub-watershed - south-west of Phewa watershed), constituting 40 % of the total volume released and 60 % of material volume affecting road network (Fig. 14, plot (a)). According to the second revision of the geological and soil cover map (Sikrikar et al., 1998), colluvial soils are indeed considered the most erosion prone of the geologic formations of the watershed. According to Sikrikar et al. (1998) and as observed in the south-west of the Phewa watershed, the quartzite formation is prone to deep gully formation, rock fall, rock slides and wedge failures involving rather rough material (rocky deposits, as gravels and boulders). Some deep and large gullies, due to road induced modification of water drainage at the origin of channelization in the steep lower-slope, were also observed in this area. Moreover, Gritty phyllite formations, covering roughly half of the total watershed area, is also susceptible to mass movement and slope failure and represents about 20 % of the total material volume released and 25 % of material volume affecting road network. Agriculture land lost surface are mostly (almost 70 %) occurring in Gritty phyllite because most agriculture areas are located in this formation (south aspect of the watershed).
Fig. 14 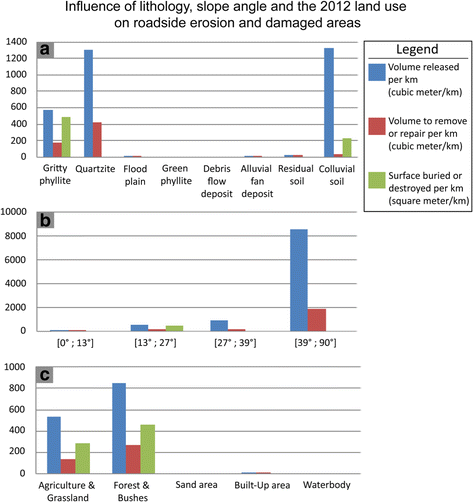
Kilometric distribution of the erosion events volume released, roadside maintenance volume and agriculture land lost surface according to: (a) lithology, (b) slope angle classes and, (c) the 2012 land use type. Note that all erosion and failure events occurred in the three main types of lithology of high susceptibility for landslides. Volume released and maintenance volume clearly growth with the slope angle, whereas land lost surface keep on the range [13°; 27°] as it mainly covered by agriculture land
-
b.
Influence of slope angle
The erosion events detected and road networks surveyed up to a slope angle of 39° clearly make the higher slope class the most prone to erosion events and volumes of soil released and thus induced road damaged cases (Fig. 14, plot (b)). The volume released per kilometer is clearly increasing with the slope angle, which is realistic considering that slope angle is a main triggering mechanism for mass movement and slope failure. Nevertheless, seeing that the road network increased coefficient in the range [39°; 90°] is very low (Fig. 10), we cannot expect a real significant increase of the material released in slope area up to 39° for the next decades. The real road impact will be more significant in the slope ranges [13°; 27°] and [0°; 13°]. Regarding agriculture land lost surface, it appears theoretically that it occurs on range [13°; 27°], area mostly covered by agriculture land.
-
c.
Influence of the 2012 land use
Erosion events and roadside slope failures are mainly occurring in forest lands (60 %) and agriculture lands (40 %) because these two land use type are covering the main part of low to highly steep areas (Fig. 14, plot (c)). A map has been prepared to put into evidence this observation: most of the roads network where erosion events are occurring is located in these two main land use classes (Fig. 15). Even if forests can be considered as protection against erosion and landsliding, in this case, slope steepness is the main factor explaining why more failures are occurring in the forest area than in agriculture area. Slope angle appears to be the most relevant parameter for explaining the erosion phenomenon induced by earthen roads in the watershed. Note finally that the agriculture surface lost found in the forest land use type is not relevant and could be translated by a lack of precision of the land use classification undertaken on a 5 m resolution satellite image in relation to the field work measurements. Earthen roads are of about 3 m maximum of wideness and measured GPS points could easily be taken into account into the bad land use class due to the rough resolution of the classification.


Surveyed roads network in relation to the 2012 land use classification in Phewa watershed. Note that the road-induced erosion areas have been placed on the map and events occur mostly in the forest and agriculture land use types
Road length, roadside erosion volume and direct costs forecasts
In addition to the volume of erosion created by road construction, this study also calculated direct economic losses for rural earthen roads due to roadside maintenance and direct agriculture land lost surface. This analysis was undertaken considering community-based road maintenance scenarios using three different types of maintenance: labor based, equipment based and mixed technology (combination between labor-based and equipment-based maintenance). A more detailed description of the methodology used is published in Additional file 1.
Table 3 summarizes data for a medium excavator (Daewoo Solar 130LC – V) and incorporates the cost of land losses for the three scenarios. Results are given also according the event age (recent, medium and old). Considering the use of ‘mixed technology’ for road maintenance, economic impacts due to rural earthen road construction in Phewa watershed amount to 49,260 USD for 42 % of the network. Assuming homogenous erosional condition along roadside in the watershed, the total cost for 100 % of earthen roads will rise to 117,287 USD and the annual earthen roads economic impact per kilometer would be 116 USD.km−1.year−1.
Furthermore, road length, erosion and cost values were forecasted in Table 4 for the period 2014–2030. It provides forecasts assuming constant rural roads growth and homogenous erosional conditions in the watershed. For instance, in 2030, 955 km of rural earthen road in the watershed will produce a total erosion volume of about 231,000 m3, which represent an economic impact of about 192,000 USD. Even if erosion and cost indexes were characterized for 42 % of the watershed road network, they are applied for the total road network. Note that the surveyed roads network may be not representative of the total network and the remaining roads may be in worse state: this observation could significantly increase erosion and cost indexes and, therefore the forecasts for the future.
Discussion
This study is the result of field work conducted in 2014 which resulted in an exhaustive inventory of the road network of Phewa Watershed (42 % of the total watershed road network) and road-related landslides. It is based on observations and measurements, which were at times roughly estimated (e.g. such as the age of an erosion event), yet supported by a statistical analysis. The study evaluated the direct and forecasted impacts of road construction as measured by volumes of soil released by road construction and related direct economic impacts. Results demonstrate that road-induced erosion in the watershed is mostly occurring on roadside embankments, which produce small and shallow soil failures which often make the road drivable for no more than one year until the next monsoon season, which was the main trigger of all failures observed.
We note that physical conditions present in the watershed naturally favor the occurrence of erosion: geology with low soil cohesion, high rates of weathering, steep slopes and one of the highest rates of rainfall in Nepal. These conditions are amplified through human activities in the watershed, often attributed to deforestation, agriculture or construction. However we note that the forest cover has actually increased over the past two decades, agriculture is in decline, whereas the rural earthen road network has expanded exponentially. Unplanned road construction without proper drainage tends to accumulate water and channel it in ways that lead to gullying, greater release of soil volumes, roadside failures and shallow landslides, especially in areas with such intense rainfall events, such as Phewa watershed. This situation leads to immediate problems: a high number of road failures, higher road maintenance costs and road cuts leading to reduced mobility and access to employment, health care, education, etc.
This field work was conducted before the 2015 Gorkha earthquake and 2015 monsoon season, with one follow-up field visit in September 2015. Although little was observed due to the 2015 earthquake, the 2015 monsoon produced exceptionally high amounts of rainfall, including one extreme rainfall event on July 29, 2015 (150.4 mm, in 24 h recorded at Panchase metrological station and 135.2 mm at Gharelu the weather station established by UNIL in 2014). The event created five debris flows in the Harpan sub-watershed (Simpani village in Bhadaure VDC) which caused 9 casualties, the destruction of at least 10 houses and numerous fields. A first inventory reveals at least 50 roadside failures, landslides and debris flows with a large number of roads completely or partially destroyed. A more detailed inventory of events is being established.
Conclusions
This study characterized the effect of road construction, a human-induced environmental phenomenon, at the scale of Phewa watershed during field work in 2014 with an update of the situation after the extreme rainfall event of July 29, 2015. As this study demonstrated, the current mode of road construction which is currently occurring in Nepal is largely related with erosion and shallow landslide processes. Considering the exponential growth of rural earthen road networks, we would expect an increase of sediments released by roads, These road- induced sediments contribute to the Phewa watershed sediment budget, however identifying other erosion sources (erosion from terraces, other natural events, etc.) was beyond the scope of this study. Thus, we cannot estimate which percentage of sedimentation is due to roads as compared to other sources of erosion. As a real ‘boom’ of rural road construction has occurred in Nepal during the past 15 years, erosion and shallow landslides have obviously increased around the country and, as Laban (1979) already warned 30 years ago, serious consideration must be taken if the road network continues to grow without more careful construction methods (Fort et al., 2010; Petley et al., 2007). It would be clearly more than the 5 % of all landslides due to roads as observed by Laban in 1979 for all of Nepal, given that the total volume of sediments released by roads today is exponentially higher as compared to the watershed area.
To minimize the amount of damage caused by rural road construction, existing road construction policies should be enforced by providing better technical support to communities, which could take into account environment and intrinsic parameters of the area for construction, such as slope angle and geological setting. Moreover, simple technologies using low cost and local resources along the lines of ‘green road’ or ‘eco-safe road’ approaches to reduce the impacts of rural road construction. Such techniques include roadside drainage to control run-off to avoid high erosion occurring at road interfaces (especially gullies formation) due to lack of proper water drainage. Furthermore, bio-engineering techniques for slope and soil protection (e.g., planting local deep-rooted species on bare roadside embankments to reduce soil erosion and stabilize slopes) (Howell, 1999) are well-known by government officials but not systematically implemented for new roads. Finally, as current road construction methods require a large amount of maintenance, any improved construction methods including bio-engineered roads with still require maintenance yet to a lesser extent (Howell, 1999). Bio-engineering constructions and roadside drainages will obviously be more efficient if routine and preventive maintenance are planned with the community (e.g., cleaning drains, cutting and caring for plants, etc.). This type of routine work can be directly carried out by hand and will clearly be less costly than the current large maintenance requirements, environmental damages and losses caused by road inaccessibility. The nuisance and damages caused by road failures in Phewa watershed are a clear hinder to population mobility and development which are the result of the lack of proper initial road design and maintenance programs.
Notes
In total 138 kilometers were surveyed, of which 9 km were paved roads.
References
Aderamo, A.J. 2013. Monitoring of road network growth in developing countries: a case of Ilorin, Nigeria. European International Journal of Science and Technology 2(7): 98–105.
Agrawala, S., V. Raksakulthai, M. Van Aalst, P. Larsen, J. Smith, and J. Reynolds. 2003. Development and Climate Change in Nepal: Focus on Water Resources and Hydropower. Paris: OECD.
Avouac, J.P. 2015. Mountain Building: From Earthquakes to Geologic Deformation. In Treatise on Geophysics, 2nd ed, ed. G. Schubert, 381–432. Oxford: Oxford UNiv. Press.
Campbell, D., Church, M. 2003. Reconnaissance sediment budgets for the Lynn Valley, British Columbia: Holocene and contemporary time scales. Canadian Journal of Earth Sciences 40: 701–713.
Cornforth, D.H. 2005. Landslides in practice: Investigation, Analysis, and Remedial/Preventative options in soils (1st edition). Hoboken, New Jersey: Wiley.
Cossart, E., and M. Fort. 2008. Consequences of landslide dams on alpine river valleys: Examples and typology from French Southern Alps. Norsk Geografisk Tidsskrift-Norwegian Journal of Geography 62: 75–88.
Crosta, G.B., P. Dal Negro, and P. Frattini. 2003. Soil slips and debris flows on terraced slopes. Natural Hazards and Earth System Sciences 3: 31–42.
DoR 2015. Road Network Data. Government of Nepal, Department of Roads. http://www.dor.gov.np/road_statistic_2008/Report%20Pages/tables/1.pdf. Accessed 20 June 2015.
Das Mulmi, A. 2009. Green Road Approach in Rural Road Construction for the Sustainable Development of Nepal. Journal of Sustainable Development 2(3): 149–165.
FEED. 2014. Development of Ecosystem based Sediment Control Technique & Design of Siltation Dam to Protect Phewa Lake: Herpan Khola Watershed Kaski. Kathmandu: FEED (P) Ltd.
Fleming, B., and J. Puleston Fleming. 2009. A watershed conservation success story in Nepal: Land use changes over 30 years. Waterlines 28(1): 29–46. doi:10.3362/1756-3488.2009.004.
Fort, M., E. Cossart, and G. Arnaud-Fassetta. 2010. Hillslope-channel coupling in the Nepal Himalayas and threat to man-made structures: The middle Kali Gandaki valley. Geomorphology 124(3–4): 178–199.
Furniss, M.J., Roelofs, T.D., Yee, C.S. 1991. Road construction and Maintenance. Influence of Forest and Rangeland Management on Salmonid Fishes and Their Habitats. American Fisheries Society, Special Publication 19: 297–323
Hashimoto, S., Y. Ohta, and C. Akiba. 1973. Geology of Nepal Himalayas. Sappdra: Himalayan Committee of Hokkaido University.
Hovius, N., Stark, C. P., Allen, P. A. 1997. Sediment flux from a mountain belt derived by landslide mapping, Geology, 25: 231–234.
Howell, J. 1999. Roadside Bio-engineering. Kathmandu: HMG Nepal, Department of Roads, Babar Mahal.
Hungr, O., S. Leroueil, and L. Picarelli. 2013. The Varnes classification of landslide types, an update. Landslides 11(2): 167–194. doi:10.1007/s10346-013-0436-y.
JICA. 2002. The Development study on the environmental conservation of Phewa Lake. Kathmandu: Silt Consultants (P) Ltd.
Keller, G., Sherar, J. 2003. Low volumes roads engineering: Best management practices field guide. USDA Forest Service/USAID. National Transportation Library.
Koirala, A., L.N. Rimal, S.M. Sikrikar, U.B. Pradhananga, P.M. Pradhan, et al. 1998. Engineering and environmental geological map of Pokhara valley. Kathmandu: Department of Mines and Geology in Cooperation with Bundesanstalt für Geowissenschaften und Rohstoffe (Federal Institute for Geosciences and Natural Resources, Hannover, Germany).
Laban, P. 1979. Landslide occurrence in Nepal. Kathmandu: Integrated watershed management torrent control and Land use development project, Ministry of Forest, Department of Soil and Water Conservation.
MoHA. 2009. Nepal Disaster Report 2009, The Hazardscape and Vulnerability. Kathmandu: Ministry of Home Affairs, Government of Nepal.
Papathome Koehle, M., and T. Glade. 2013. The role of vegetation cover change in landslide hazard and risk. In The Role of Ecosystems in Disaster Risk Reduction, ed. F. Renaud, K. Sudmeier Rieux, and M. Estrella, 293–320. Tokyo: UNU Press.
Petley, D., G.J. Hearn, A. Hart, N. Rosser, S. Dunning, K. Oven, and W. Mitchell. 2007. Trends in landslide occurrence in Nepal. Natural Hazards 43: 23–44.
Rimal, B., H. Baral, N. Stork, K. Paudyal, and S. Rijal. 2015. Growing City and Rapid Land Use Transition: Assessing Multiple Hazards and Risks in the Pokhara Valley, Nepal. Land 4: 957–978.
Sharma, B.K., K. Timalsina, R. Rai, S.K. Maharjan, A. Joshi, and B. Rakhal. 2013. Biodiversity Resource Inventory, Ecosystem Assessment of Bhadaure Tamagi VDC, Kaski: An Ecosystem-based Adaptation in mountain Ecosystem in Nepal. Lalitpur: IUCN Nepal.
Sharma, S., and M.L. Maskay. 2009. Community Participation and Environmental Protection in the Construction of Mountain Roads: Promotion of the “Green Road” Approach in Nepal. New York: Transportation and Communication bulletin for Asia and Pacific, No. 69, Participatory approach to transport infrastructure development, United Nation.
Sikrikar, S.M., L.N. Rimal, M. Kerntke, S. Jäger, et al. 1998. Landslide hazard zonation map of Phewa Lake catchment area, Pokhara, Nepal. Kathmandu: Department of Mines and Geology in Cooperation with Bundesanstalt für Geowissenschaften und Rohstoffe (Federal Institute for Geosciences and Natural Resources, Hannover, Germany).
Sthapit, K.M., and M.K. Baila. 1998. Sediment Monitoring of Phewa Lake. Watershed Management and Environmental Science. Kathmandu: Institute of Forestry.
Sudmeier Rieux, K. 2011. On Landslide Risk, Resilience and Vulnerability of mountain Communities in Central-Eastern Nepal. Lausanne: Université de Lausanne, Faculté des Géosciences et de l’Environnement, Institut de Géomatique et d’Analyse de Risque.
Validya, K.S. 1985. Accelerated erosion and landslides-prone zones in the Himalayan region. In Environmental Regeneration in Himalaya: Concepts and Strategies. Nainital: Central Himalayan Environmental Association.
Validya, K.S. 1987. Environmental Geology. New Delhi: Indian Context, Tata-McGraw-Hill.
World Bank. 2013. Nepal road sector assessment study: Main report. Kathmandu: World Bank.
Funding
This research was conducted as part of the Ecosystems Protecting Infrastructure and Communities project through the International Union for Conservation of Nature, made possible through funding from the International Climate Initiative, supported by the German Federal Ministry for the Environment, Nature Conservation, Building and Nuclear Safety (BMUB).
Author information
Authors and Affiliations
Corresponding author
Additional information
Competing interests
The authors declare that they have no competing interests.
Authors’ contributions
KSR supervised this research work and helped to draft the manuscript by providing a writing assistance. SD participated in the field work campaign and helped to acquire the data. LN furnished a technical help to vectorize the aerial photos and the satellite images. MJ, MHD and IP provided a technical help and general support in this research by helping in the interpretation of results. All authors read and approved the final manuscript.
Additional file
Additional file 1:
Economic estimation of the impact of rural earthen road construction in Phewa watershed. (DOCX 20 kb)
Rights and permissions
Open Access This article is distributed under the terms of the Creative Commons Attribution 4.0 International License (http://creativecommons.org/licenses/by/4.0/), which permits unrestricted use, distribution, and reproduction in any medium, provided you give appropriate credit to the original author(s) and the source, provide a link to the Creative Commons license, and indicate if changes were made.
About this article

Cite this article
Leibundgut, G., Sudmeier-Rieux, K., Devkota, S. et al. Rural earthen roads impact assessment in Phewa watershed, Western region, Nepal. Geoenviron Disasters 3, 13 (2016). https://doi.org/10.1186/s40677-016-0047-8
Received:
Accepted:
Published:
DOI: https://doi.org/10.1186/s40677-016-0047-8